HCL Technologies fell over 5% on June 18, dropping below major price averages. We explain what this means for investors and why technical indicators are currently a focus in the IT sector.
What Happened
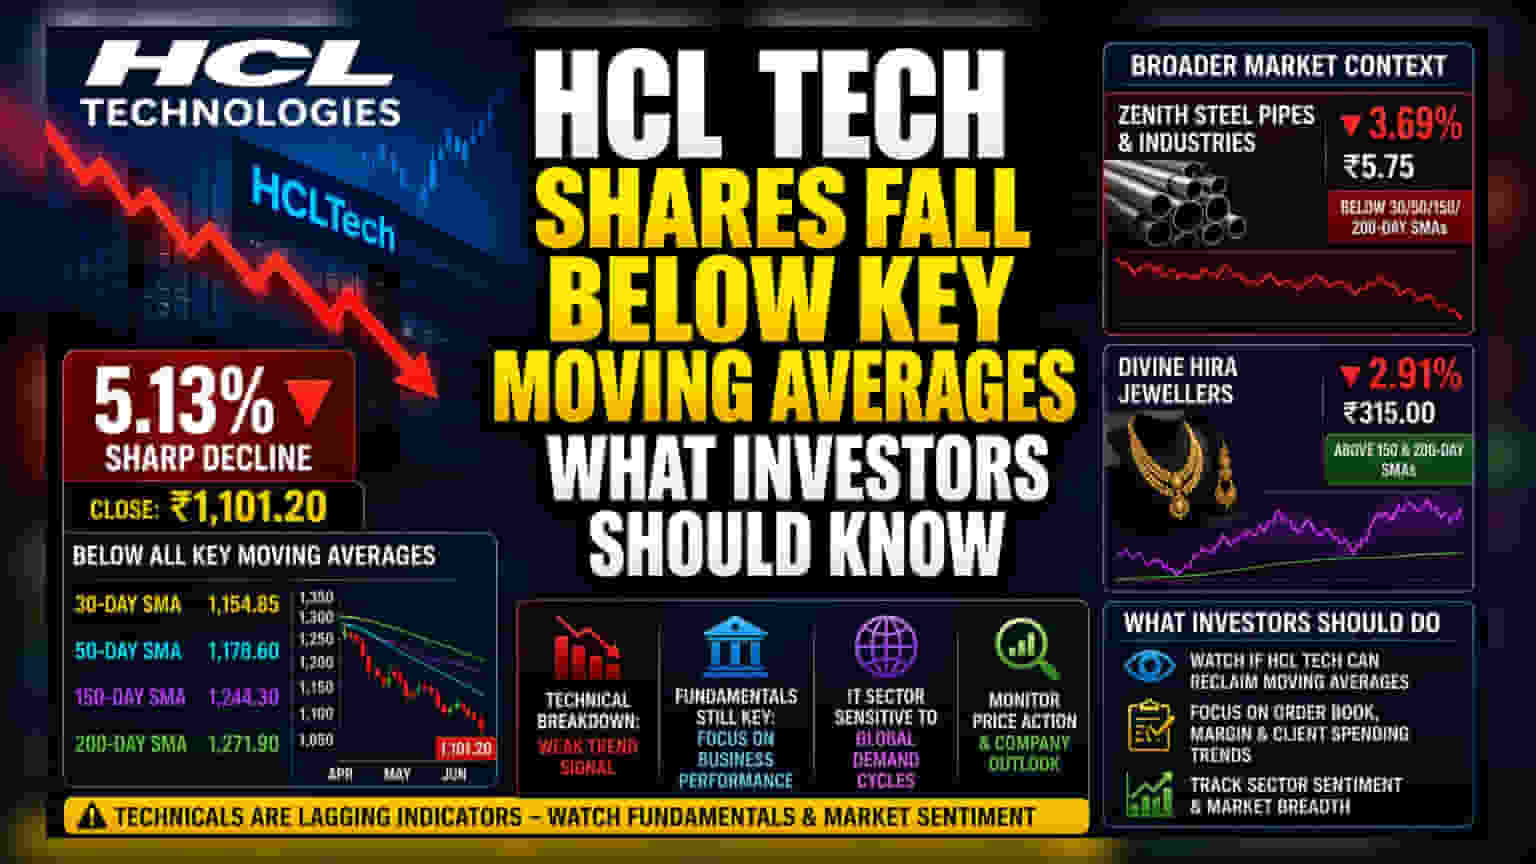
On June 18, shares of HCL Technologies witnessed a sharp decline of 5.13%, closing at ₹1,101.20. Alongside this move, the stock fell below its 30-day, 50-day, 150-day, and 200-day simple moving averages. In technical analysis, these averages are often used by investors and traders to identify the average price of a stock over a specific period. When a stock trades consistently below these levels, it often suggests that the recent price trend is leaning toward the downside.
Why This Matters For Investors
For many market participants, moving averages serve as a guide to judge the health of a stock’s price trend. When a large, well-followed stock like HCL Technologies dips below its long-term averages, such as the 150-day or 200-day, it can signal that buyers are currently less active or that sellers are putting pressure on the share price. However, it is important to remember that these indicators reflect past price history rather than future company performance. Fundamentals, such as order books, profit margins, and client spending trends, remain the core drivers of long-term value in the IT sector.
Broader Market Context
While HCL Technologies faced downward pressure, the broader market showed mixed activity. Other stocks also experienced technical shifts. Zenith Steel Pipes & Industries saw a decline of 3.69% to ₹5.75, remaining below its critical moving averages, which indicates a continuation of its recent price trend. Divine Hira Jewellers fell 2.91% to ₹315.00. Unlike the others, this stock managed to stay above its 150-day and 200-day moving averages, suggesting that while it faces near-term selling, its longer-term price structure may still be holding ground compared to its shorter-term performance.
The IT Sector Lens
Indian IT companies are closely linked to global demand cycles, particularly in markets like the United States and Europe. Changes in technology spending, interest rates in developed economies, and the adoption of new technologies like AI often dictate the sentiment for the Nifty IT sector. A technical breakdown in a major index stock can sometimes be a reflection of broader concerns regarding margin stability or growth outlooks for the sector. Investors often look to see if such price drops are driven by company-specific news or a general shift in sector sentiment.
What Investors Should Monitor Next
Investors may look for stability in the share price and wait to see if the stock can reclaim its moving averages in the coming days or weeks. The key monitorable remains company commentary regarding future revenue growth and any updates on client budgets, which ultimately drive the business. Since technical indicators are lagging measures, they are best used alongside fundamental analysis rather than in isolation. Those tracking these companies may also keep an eye on overall market breadth, as technical breakdowns in a few large-cap stocks can sometimes influence the sentiment of the entire index.