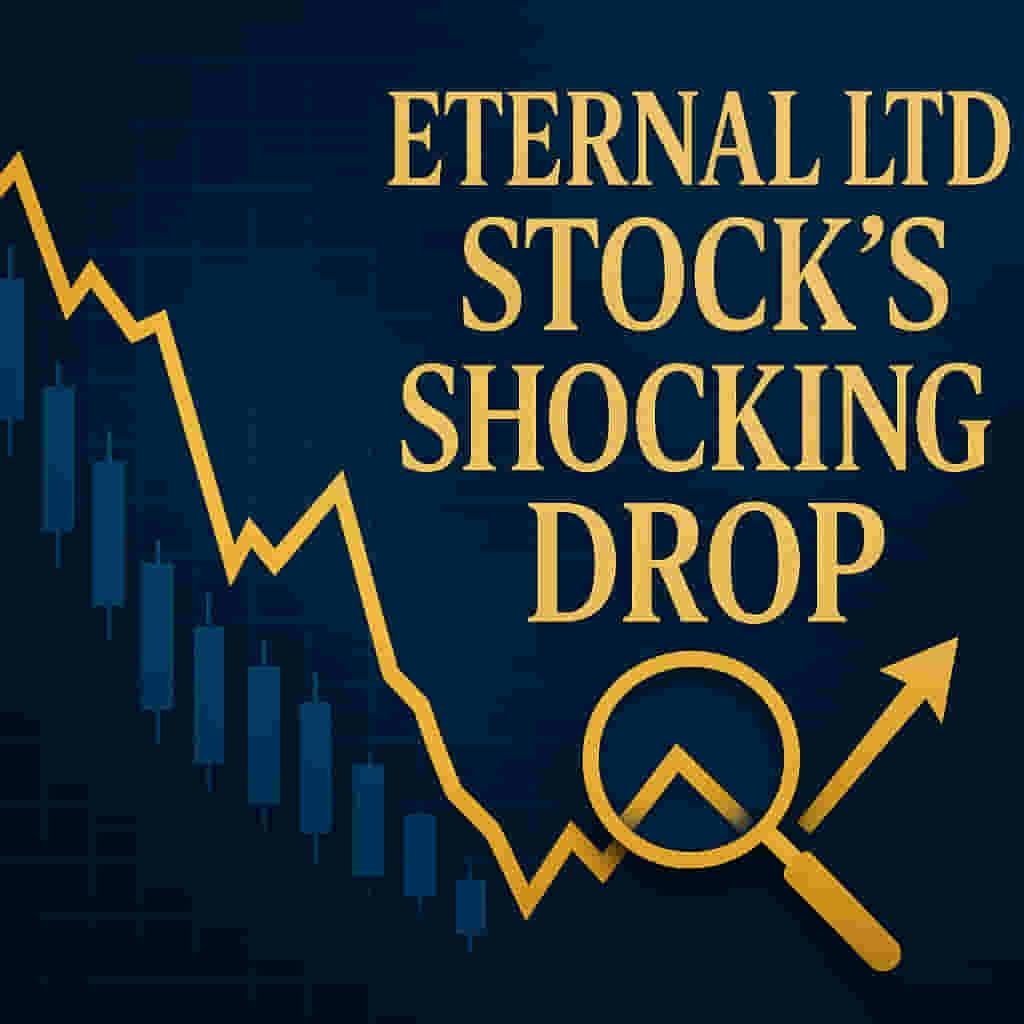
Eternal Ltd, a stock known for its strong long-term performance, has experienced a recent downturn, falling nearly 5% in the past month. However, technical analysts suggest this dip might present a buying opportunity as the stock approaches key support levels.
Company Performance
- Eternal Ltd has been a significant wealth creator, with shares surging over 130% since listing.
- In 2025, the stock has seen considerable volatility, trading at Rs 289.80 as of December 11, with a year-to-date gain of 4.81%.
- The stock hit a peak of Rs 368.45 in October before correcting in the last quarter.
Financial Snapshot
- Recent quarterly results highlight rapid expansion alongside increasing costs.
- Q1 FY26 showed revenue of Rs 7,167 crore and a net income of Rs 25 crore, with negative operating income reflecting heavy investment.
- Q2 FY26 saw a substantial business surge: revenue jumped 89.62% to Rs 13,590 crore, and net income rose 160% to Rs 65 crore.
- Despite revenue and profit growth, operating income remained negative at Rs –137 crore in Q2 FY26, indicating continued aggressive spending for scaling up.
- The company possesses substantial assets (Rs 38,115 crore) and liquid assets (Rs 4,643 crore), providing a strong financial cushion.
Analyst Outlook
- Kkunal V. Parar from Choice Broking notes the stock is in a short-term downtrend.
- He identifies a critical support zone around the 200-day Moving Average, near Rs 275.
- A price gap formed on July 22, with its lower end near Rs 277, further reinforcing this support area.
- The Relative Strength Index (RSI) is around 33, nearing the 30-mark, which suggests potential oversold conditions and a possible reversal.
Future Expectations
- Parar anticipates a meaningful rebound if the Rs 275 support level holds.
- The potential upside target is projected between Rs 310 and Rs 340.
- Strong downside support is seen at Rs 255.
Market Context
- The recent stock correction appears to be influenced by broader market weakness and profit-booking.
- Eternal's fundamentals, including strong revenue growth and balance sheet, remain robust despite the current investment phase.
Impact
- For long-term investors, the current dip could be an accumulation opportunity if support levels hold.
- Short-term traders must monitor the Rs 275–277 zone closely; a breach could signal further decline.
- Impact Rating: 6/10
Difficult Terms Explained
- EBITDA: Earnings Before Interest, Taxes, Depreciation, and Amortization. It shows a company's operating profitability.
- Operating Income: Profit from a company's core business operations after deducting operating expenses.
- Moving Average (MA): A widely used technical indicator that smooths out price data by creating a constantly updated average price. The 100-day and 200-day MAs are common for tracking medium-term and long-term trends, respectively.
- RSI (Relative Strength Index): A momentum oscillator used to measure the speed and change of price movements. It typically ranges from 0 to 100 and is used to identify overbought or oversold conditions. A reading below 30 often indicates oversold.
- Price Gap: A phenomenon in stock price charts where a significant price jump or drop occurs, creating a "gap" between the closing price of one trading period and the opening price of the next.