With the Nifty 50 continuing its upward trend, market analysts are observing specific technical chart patterns in several companies. These observations often reflect short-term trading interest rather than changes in long-term business fundamentals.
What Happened
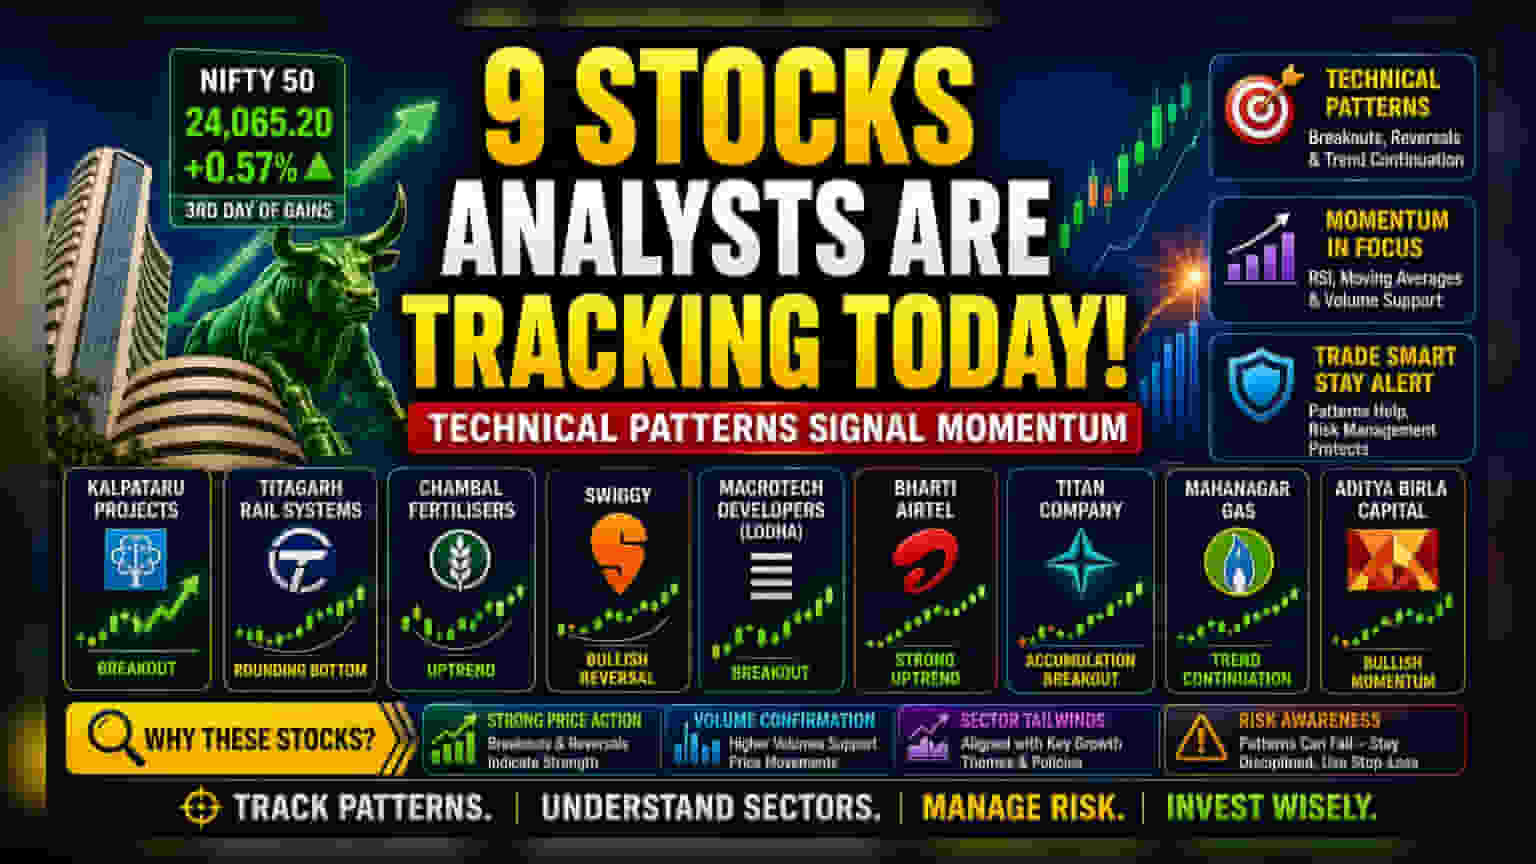
Indian equity markets maintained positive momentum for the third consecutive session as of June 16, with the Nifty 50 index closing 0.57% higher. As the market sentiment improved, analysts have highlighted a set of stocks exhibiting specific technical patterns. These patterns—such as price breakouts or trend reversals—are commonly used by traders to identify short-term momentum. The companies currently drawing attention include Kalpataru Projects, Titagarh Rail Systems, Chambal Fertilisers, Swiggy, Macrotech Developers (Lodha), Bharti Airtel, Titan Company, Mahanagar Gas, and Aditya Birla Capital.
The Logic Behind Technical Observations
When analysts point to specific stocks based on charts, they are generally looking at price history and trading volumes. For instance, patterns like a 'rounding bottom' or a 'breakout' suggest that the stock price might be shifting from a phase of stagnation to one of movement.
Analysts often use tools like the Relative Strength Index (RSI) to see if a stock has gained too much speed or if it has room for more. Moving averages act as a baseline to help determine if the current price is trending upward or downward compared to its average performance over recent weeks or months. These metrics provide a snapshot of supply and demand for the stock at a specific moment in time.
Sector Themes in Focus
Different companies mentioned are currently part of broader sector narratives that investors often follow. For example, the infrastructure and railway sector, represented by companies like Kalpataru Projects and Titagarh Rail Systems, often reacts to news regarding government spending and order books.
Similarly, in the consumer-facing sector, names like Titan and Bharti Airtel are frequently tracked for their ability to manage demand cycles. Financial services firms like Aditya Birla Capital are often viewed through the lens of credit growth and the overall health of the lending environment. While these sector themes provide context, the technical patterns observed by analysts act as a separate layer that suggests whether these stocks are currently 'in favor' or 'out of favor' among active market participants.
How Investors May Read This
It is important to remember that technical patterns are not guarantees of future performance. They are simply observations of how stocks have moved in the recent past. A stock breaking out of a pattern does not mean the underlying business performance has changed overnight.
Active traders use these indicators to manage short-term positions. However, for long-term investors, fundamental factors—such as quarterly earnings, debt levels, management decisions, and industry competition—are far more reliable drivers of value than short-term price charts.
What Could Go Wrong
Trading based on technical patterns carries inherent risks. A key risk is a 'false breakout,' where a stock price seems to be rising but fails to sustain the momentum, potentially leading to losses if stop-losses are triggered. Market volatility, unexpected news, or shifts in macroeconomic policy can override technical patterns instantly. Furthermore, relying solely on charts without considering the company’s financial health or external sector pressure, such as rising commodity costs or regulatory changes, can lead to incomplete investment decisions.
What Investors Should Track Next
The most important monitorable is whether these technical patterns hold up over the next few trading sessions. If a stock fails to sustain its breakout level, the interest may quickly fade. Investors should track official company filings for any material information that might explain the price movement, as sentiment can change rapidly. Monitoring volume—the number of shares traded—is also crucial, as meaningful price moves are typically supported by high trading volume.