

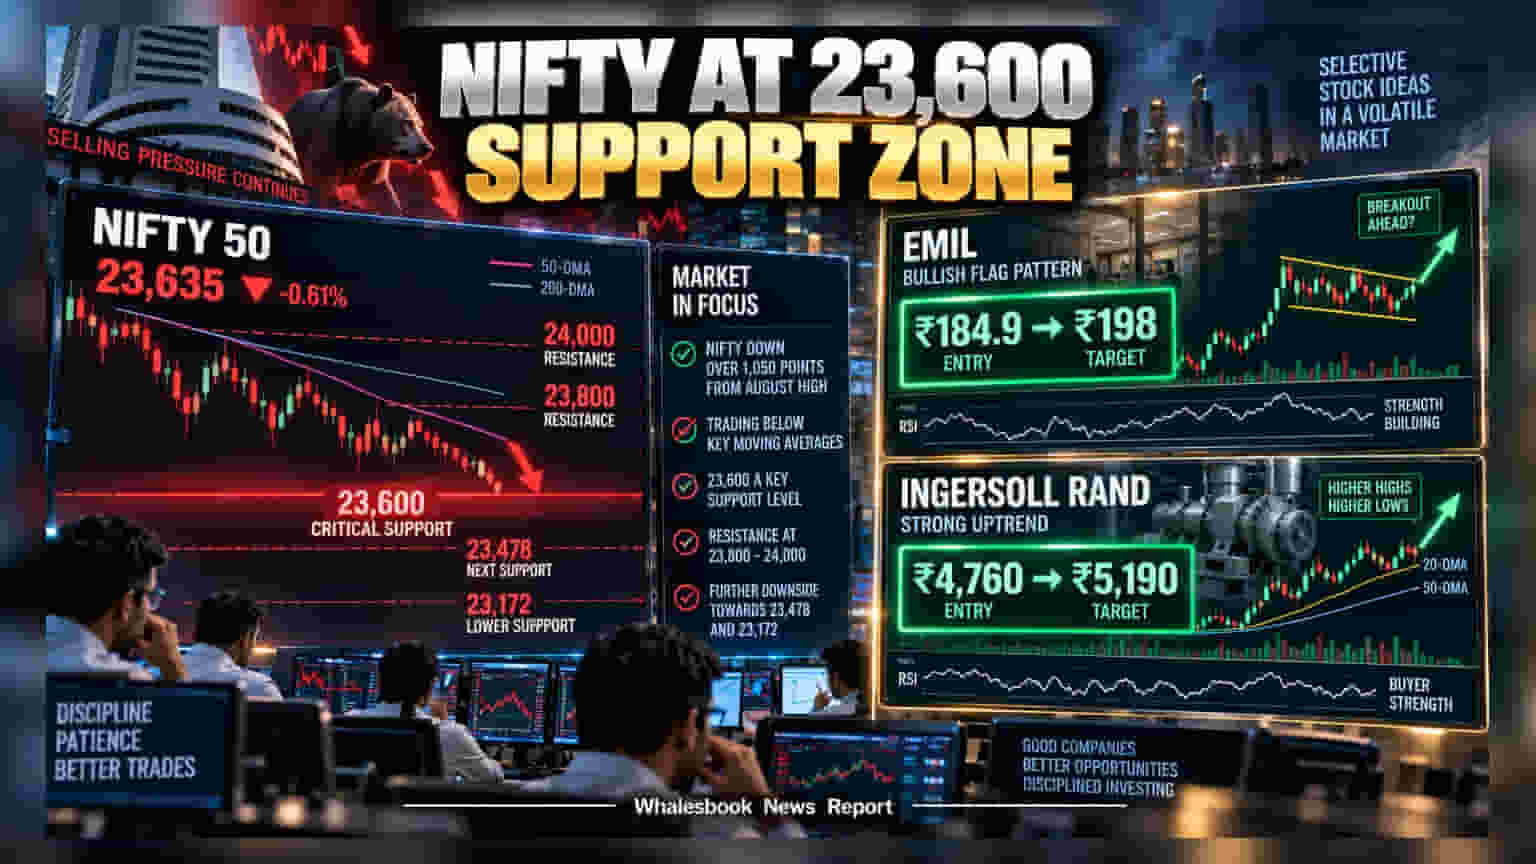
The Nifty 50 has corrected over 1,050 points from its August peak, testing a critical support level at 23,600. While the broader market remains in a bearish trend, analysts at HDFC Securities have highlighted potential technical setups for Electronics Mart India and Ingersoll Rand. Investors should note these are short-term trading ideas, and the market's direction depends on holding current support levels.
The Nifty 50 index is currently facing selling pressure, having fallen more than 1,050 points from its August swing high of 24,774. The index is now trading below key moving averages, a pattern that technical analysts often associate with a bearish trend. Investors are now closely watching the 23,600 mark, which serves as a critical support level. If the index fails to hold this level, it could lead to further declines toward lower support zones.
While the market sentiment is cautious, analysts at HDFC Securities have pointed to specific stocks that show interesting chart patterns. It is important to distinguish these as technical trading setups, which focus on short-term price movements and patterns rather than long-term fundamental analysis.
Electronics Mart India Limited (EMIL) is one such stock highlighted for a technical 'bullish flag' pattern. This chart formation often suggests that a stock is consolidating before potentially continuing its upward trend. From a fundamental perspective, EMIL reported a strong 458% year-on-year surge in net profit to ₹121 crore for the first quarter of fiscal year 2027. However, potential investors should also weigh this against specific risks, including a return on equity of 10.3% over the last three years and high valuation metrics compared to certain sector peers.
Ingersoll Rand India Limited is the second stock noted for its technical strength. The stock has maintained a positive structure, consistently forming higher highs and higher lows, and recently rebounded from its 20-day exponential moving average. Unlike stocks in a downtrend, this industrial player has shown resilience during the recent market volatility, keeping it above major moving averages.
For investors, the most important takeaway is the difference between these isolated stock setups and the broader market trend. A technical setup on a daily chart can be quickly invalidated if the Nifty index breaks below its support levels, as market-wide selling often drags down individual stocks regardless of their chart patterns. The current resistance for the Nifty remains in the 23,800 to 24,000 zone. Until the index can decisively trade above these levels, the overall market environment remains vulnerable. Investors should also consider external factors like elevated crude oil prices and global geopolitical tensions, which continue to act as headwinds for risk sentiment across Indian markets.