

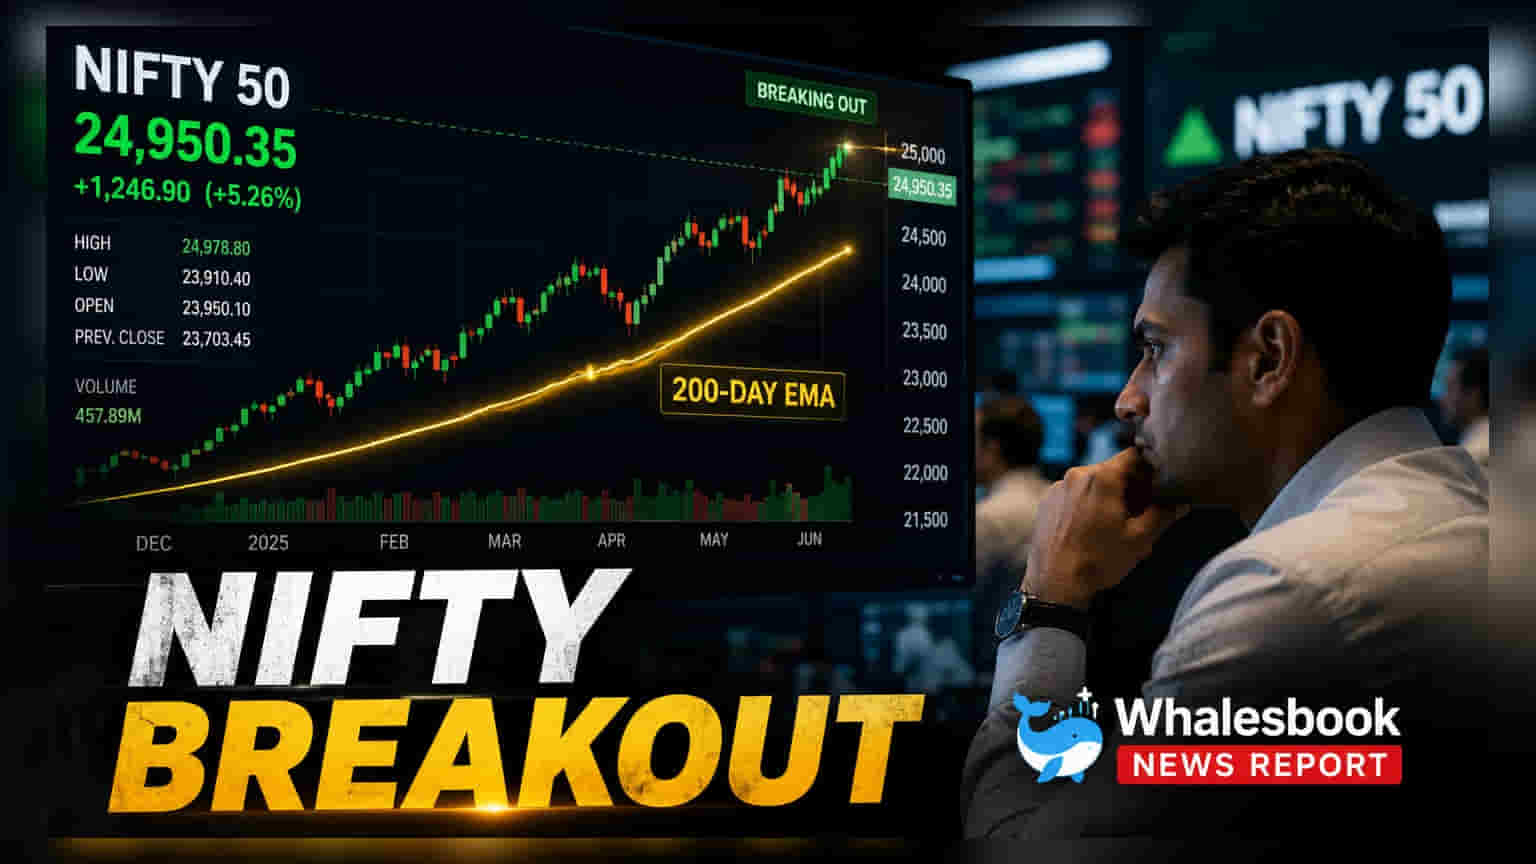
The Nifty 50 climbed 0.66% on July 6, surpassing its 200-day Exponential Moving Average for the first time since February. This gain marks a four-day winning streak, shifting investor focus toward the April high of 24,600. Lower volatility, with the India VIX at 11.82, supports the current market sentiment.
The Indian equity market maintained a positive trend on July 6, with the Nifty 50 recording its fourth consecutive day of gains. The index rose 0.66 percent to close firmly above its 200-day Exponential Moving Average (EMA). This is a technical milestone for the index, as it has traded below this long-term trend indicator since February 26. By settling above this level, the market shows it is currently trading above its short, medium, and long-term averages, which often signals to traders that the recent trend is strengthening.
Technical data points suggest that buying momentum is picking up. The Relative Strength Index (RSI), which measures the speed and change of price movements, climbed to 64.11. Additionally, the index has moved past the 50 percent Fibonacci retracement level of the correction seen between February and April, a threshold the market had not cleared since early May. These indicators together suggest that the selling pressure seen in previous months has eased, allowing for a steady rise in index values.
Upside Potential and Support Levels
Market attention is now turning toward the previous swing high of 24,600 set in April. Investors and analysts are monitoring this zone as a key resistance point. If the Nifty 50 maintains its position above the support range of 24,200 to 24,300, it may attempt to challenge this April peak. A successful move beyond 24,600 could see the index targeting the 24,750 to 24,800 range, which corresponds to the 61.8 percent Fibonacci retracement level. The 24,000 mark remains a significant psychological and technical base for the index.
Market volatility, as measured by the India VIX, remains low at 11.82. A stable or declining VIX often provides a more comfortable environment for investors, as it indicates less uncertainty. As long as this volatility gauge stays below 13, the current structure of the market remains largely supportive of the prevailing trend.
Banking Sector Performance
The Bank Nifty also contributed to the overall market sentiment, closing at 58,292 after a gain of 353 points. The banking index continues to trade above its primary moving averages, pointing to a stable structure. The 50-day EMA in the Bank Nifty is approaching a crossover of the 100-day and 200-day averages, a technical signal that typically garners attention from market analysts looking for long-term trend shifts. Future moves in the banking index will likely face resistance near 58,500 and 58,800, while support is currently identified near 57,500 to 57,800. The next major technical milestone for the banking sector, if it sustains current momentum, is the 60,000 level.