Professional market participants are increasingly using Option Open Interest (OI) to find real-time support and resistance levels. Unlike traditional price charts, OI shows where major capital is actually positioned in the market. Understanding this data can help investors see where option sellers are defending their ground, providing a clearer picture of potential market turning points.
Beyond Price Charts: The Role Of Open Interest
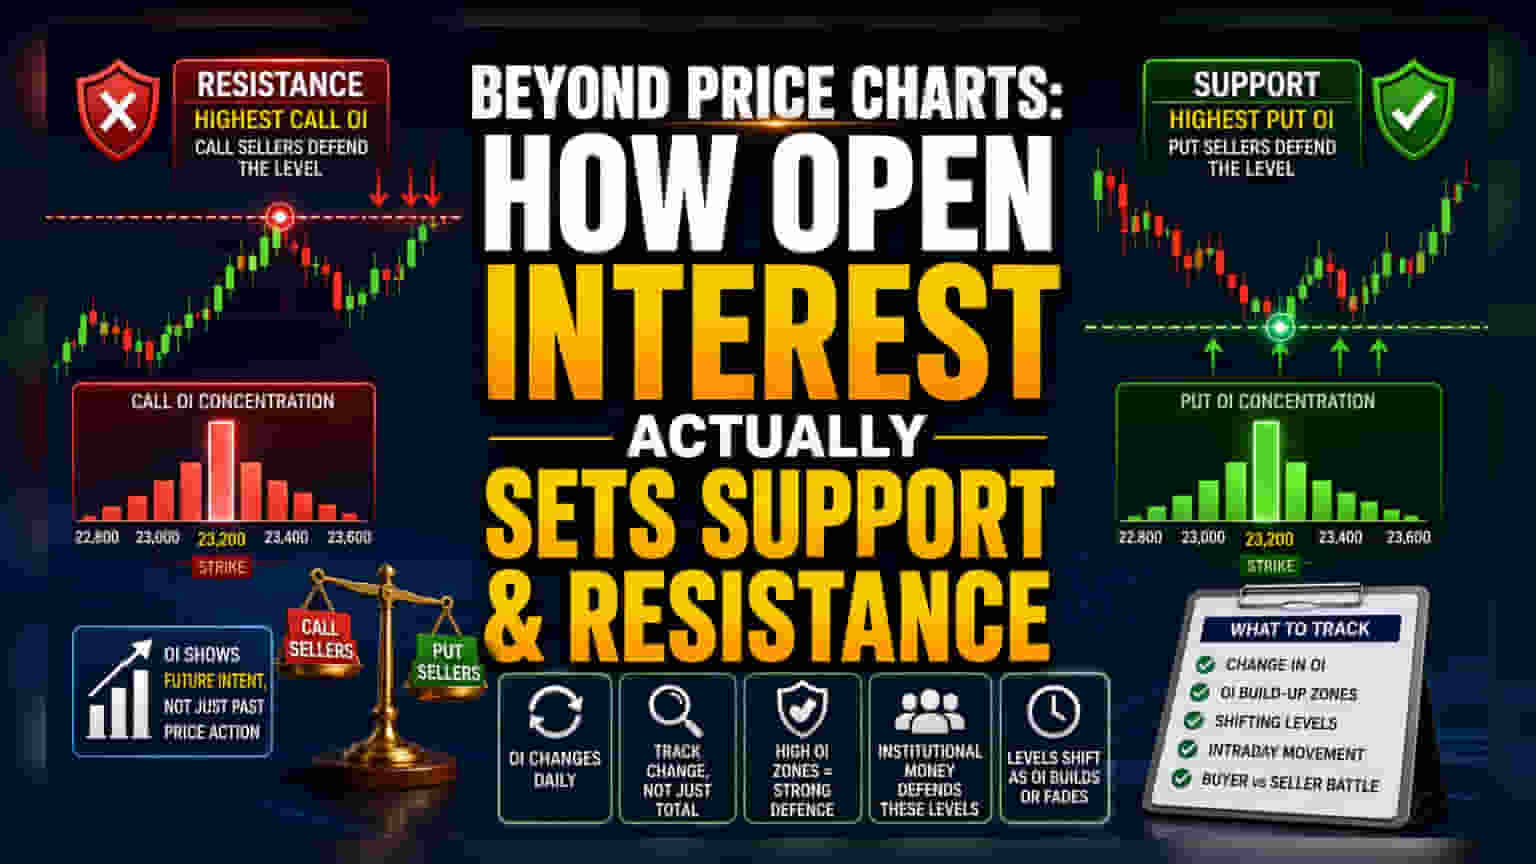
Many investors rely on standard price charts to draw horizontal lines that mark support and resistance. However, price action can be erratic, and these static lines often fail to capture the actual intent of market participants. Increasingly, traders are looking at Option Open Interest (OI) to identify zones where significant capital is committed. While price charts reflect what has already happened, Open Interest provides insight into where professional money is positioned for the future.
Understanding Option Open Interest
Open Interest refers to the total number of outstanding option contracts that have not yet been settled or closed. When a new contract is created, OI increases; when a contract is closed, OI decreases. On the NSE option chain, this data is updated, allowing investors to see the concentration of contracts at various strike prices. This creates a map of where market participants are betting on the price to remain or reverse.
Why Option Sellers Define Support And Resistance
To understand support and resistance via OI, it is helpful to look at the perspective of option sellers, who often represent institutional or large-scale capital.
Call sellers, who profit when the market stays below a certain level, tend to defend their strike prices aggressively. Consequently, the strike price with the highest Call Open Interest often acts as a significant resistance zone. If the market approaches this level, the pressure from sellers to keep the index or stock price below that strike can intensify.
Conversely, Put sellers profit when the market stays above their strike price. They are motivated to ensure the price does not fall below their level. Therefore, the strike price with the highest Put Open Interest typically serves as the strongest support zone. When the market nears this level, it is common to see a surge in buying activity as these sellers protect their positions.
The Importance Of Dynamic Data
Static support and resistance levels are fixed, but the market is constantly changing. Option OI is fluid. Investors should note that a concentration of OI today may shift tomorrow. For example, if Call OI begins to build up at a lower strike price, it signals that resistance is forming at a lower level, which may indicate weakening sentiment. Similarly, a rise in Put OI at a higher strike suggests that support is moving upward, often reflecting increased confidence.
What To Track Next
Investors looking to use this data should focus on the change in OI rather than just the total number. A substantial increase in OI at a specific strike price is often a stronger signal than a high accumulated total, as it reflects the current intent of market participants. Tracking how these levels shift during trading hours can help provide a more grounded view of the battle between buyers and sellers, moving beyond simple technical analysis to understand the real financial stakes involved.