

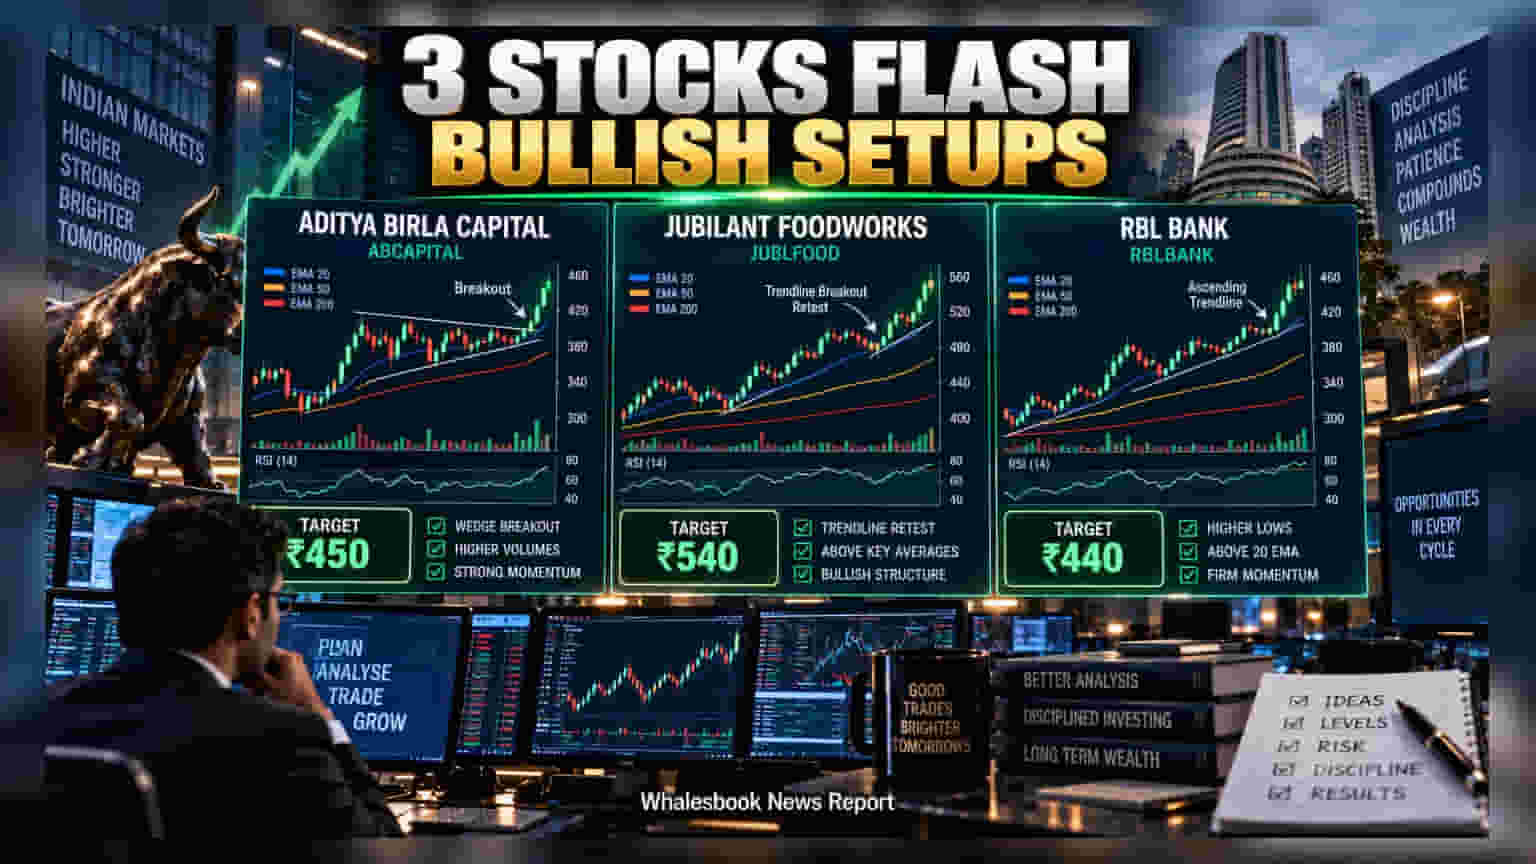
Analysts at Choice Broking have flagged specific technical patterns in Aditya Birla Capital, Jubilant FoodWorks, and RBL Bank based on recent price movements. These observations focus on chart structures like breakouts and support retests. Investors should note that technical analysis reflects historical price trends and does not guarantee future results. Fundamental performance, sector-specific challenges, and market conditions remain critical factors for any investment decision.
Market analysts often use technical charts to spot trends in how stock prices move. Recently, the technical team at Choice Broking highlighted specific price patterns for Aditya Birla Capital, Jubilant FoodWorks, and RBL Bank. These observations are based on historical price data rather than company financial results or corporate announcements.
Aditya Birla Capital and Price Momentum
Aditya Birla Capital, a financial services holding company with interests in lending, insurance, and asset management, has been observed moving above a specific chart pattern known as a wedge on the daily timeframe. When a stock breaks above this type of boundary on higher trading volumes, it often indicates increased buying interest. Analysts monitoring the stock have pointed to its position above key averages, such as the 20-day and 50-day exponential moving averages, as a sign of current short-term strength. The relative strength index, a tool used to measure the speed and change of price movements, has also shown improvement, suggesting that the stock is moving in a positive direction without showing extreme signs of being overbought.
Jubilant FoodWorks and Support Levels
Jubilant FoodWorks, the operator of the Domino’s Pizza chain in India, has caught attention for successfully retesting a long-term trendline breakout. In technical terms, a retest means the price pulled back to a previous resistance level and found support, potentially turning that old resistance into a new floor. The stock has been trading above major moving averages, which analysts view as a sign of a stable upward trend. For the quick-service restaurant sector, factors such as food inflation and changing consumer spending habits often impact profitability. Investors typically watch whether the company can maintain its volume growth amid these broader sector pressures.
RBL Bank and Upward Structures
RBL Bank has been observed holding above an ascending trendline, which reflects a series of higher lows in the stock price. This structure is often interpreted by analysts as a sign of sustained buyer interest. The bank continues to trade above its 20-day exponential moving average, which is a common indicator used to track short-term sentiment. While the stock shows firmer momentum compared to other recent picks, it is important to remember that banking stocks are highly sensitive to interest rate cycles, credit growth, and asset quality. The technical setup remains active as long as the stock maintains its current trendline.
Technical observations are based on past price action and do not account for risks such as changes in government policy, raw material costs for retail companies, or credit risks for financial institutions. Because these insights are purely chart-driven, they do not consider the company's long-term financial health, debt levels, or management quality. Investors should look at these price levels as market observations rather than recommendations, as chart patterns can fail if market sentiment changes quickly.