

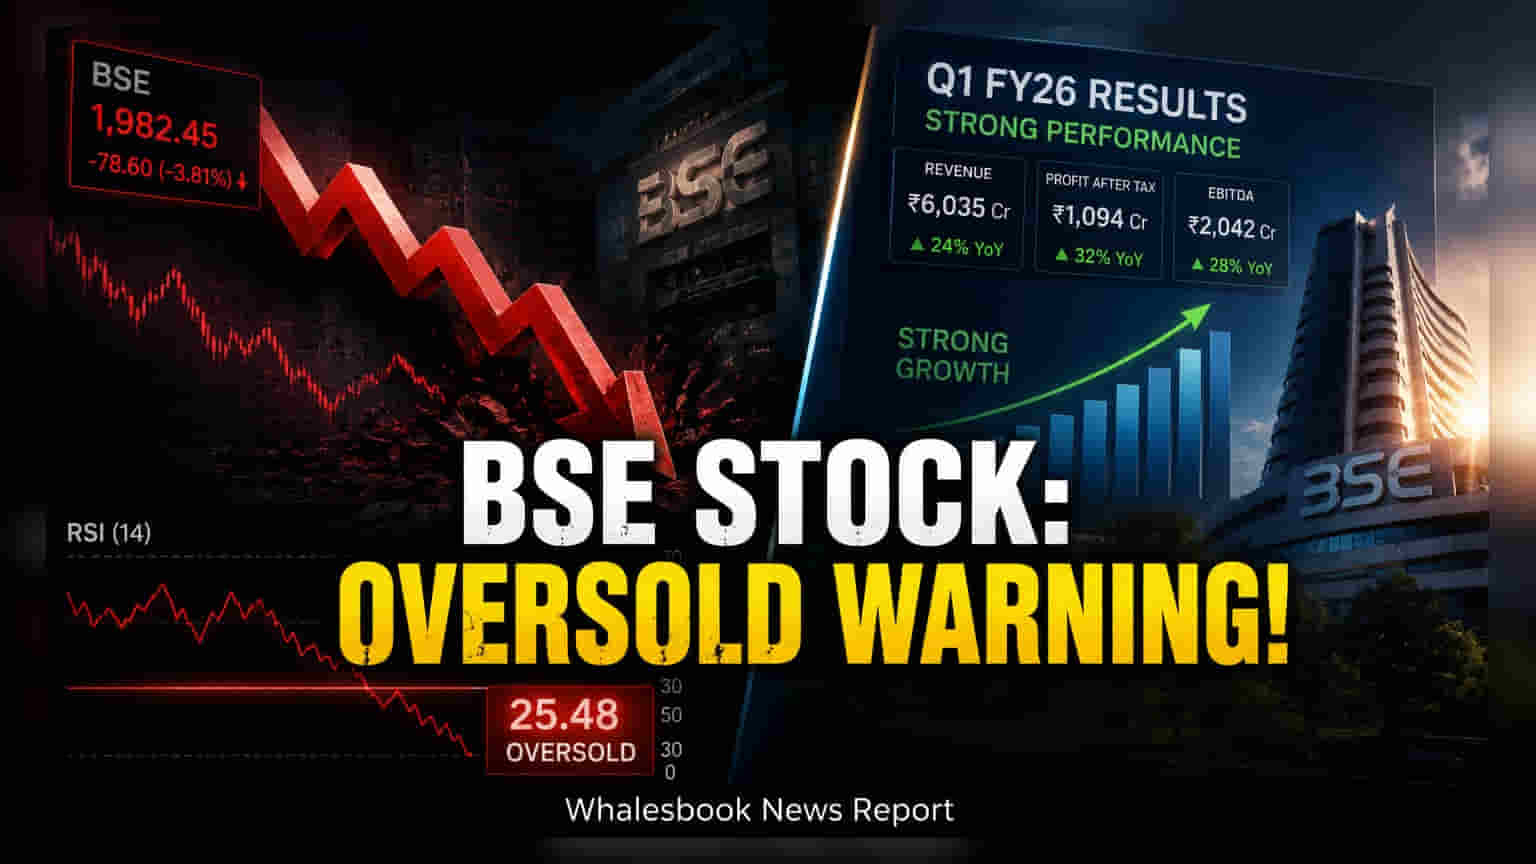
BSE Ltd. shares have dropped 22.4% from their May 2026 high, with technical indicators recently touching oversold levels. While analysts expect strong first-quarter growth when results are declared on August 4, 2026, the stock currently faces pressure as it trades below key moving averages.
BSE Ltd. has seen its share price decline by 22.4% since hitting a record high of ₹4,446.80 on May 27, 2026. The stock touched a recent low of ₹3,451.10 on July 28, 2026, marking a period of sustained downward movement. By Wednesday, July 29, 2026, the stock recovered slightly, trading at ₹3,555. This decline has drawn attention to the company's technical setup, as the stock has spent recent sessions trading below its 20-day, 50-day, and 100-day exponential moving averages.
Technical Indicators and Price Trends
The 14-day Relative Strength Index (RSI), which helps measure whether a stock is overbought or oversold, recently dropped below 30 to reach 29.14. This is the first time the stock has entered this technical territory since August 2025. While a low RSI can sometimes suggest that a stock has been oversold, analysts from SBI Securities have noted that the ongoing lower-high and lower-low pattern indicates that the overall downtrend remains active. Additionally, indicators such as the Moving Average Convergence-Divergence (MACD) are currently positioned below the zero line, which typically reflects bearish momentum in the market.
Upcoming Financial Results
Despite the recent share price weakness, the company is approaching a major event with the release of its first-quarter financial results scheduled for August 4, 2026. Fundamental projections suggest strong growth compared to the same period last year. Estimates indicate that revenue could reach ₹1,565 crore, with EBITDA potentially hitting ₹1,132 crore and profit after tax projected at ₹843 crore. These figures, if met, would represent year-on-year growth rates of 63%, 81%, and 57%, respectively. This expected performance is largely tied to increased activity in cash and derivatives markets, alongside gains from corporate service listings.
Key Monitorables for Investors
For those observing the stock, the zone between ₹3,580 and ₹3,600 serves as a significant resistance level, representing the stock's 100-day moving average. Investors may track whether the share price can consistently trade above this range, which would signal a shift in sentiment. Conversely, the ₹3,400 to ₹3,420 range remains a level of immediate support. Beyond technical levels, the primary focus for market participants will be the actual financial report on August 4, specifically the management commentary regarding transaction volumes and the sustainability of revenue growth in the coming quarters.