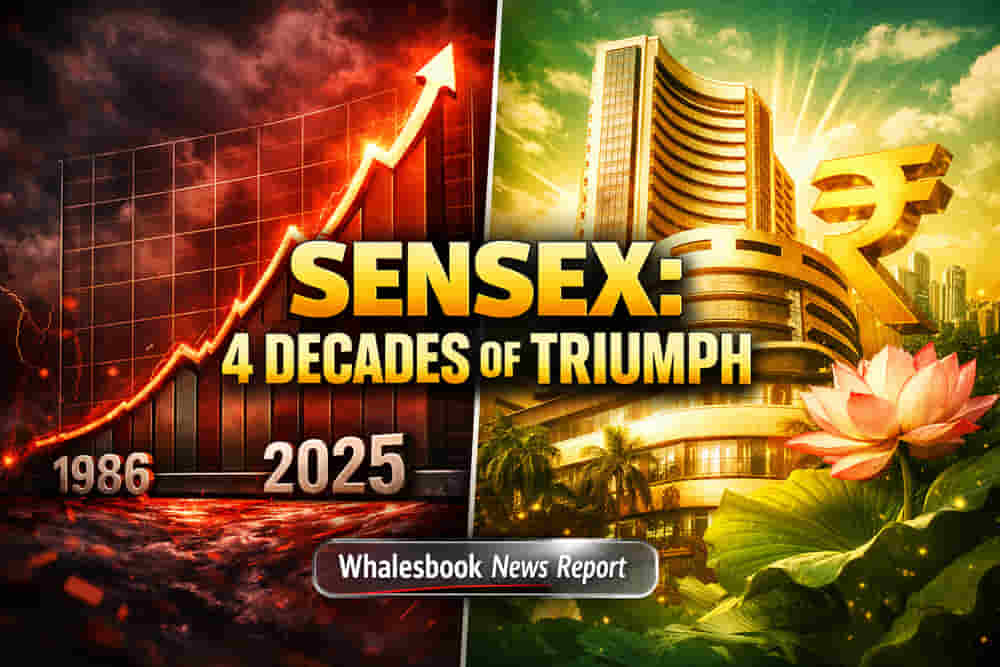
Sensex Marks Four Decades of Growth
On January 1, 2026, the Sensex will celebrate its 40th anniversary as the primary benchmark index for the Bombay Stock Exchange, Asia's oldest stock exchange. Over these four decades, the Sensex has charted a course mirroring India's own ascent into the world's fourth-largest economy. It has generated a significant Compound Annual Growth Rate (CAGR) of 13.4%, climbing from an initial level of 549 points to reach approximately 85,220 points by the close of 2025. This performance closely aligns with India's nominal GDP growth of 12.62% during the same timeframe, indicating a strong correlation between market performance and national economic expansion.
The Era of Liberalization and Early Volatility
While the Bombay Stock Exchange has a history dating back to 1875, the 30-share Sensex index was formally established in January 1986. The early 1990s heralded a period of dramatic acceleration, largely spurred by economic liberalization policies introduced in 1991. This reform triggered a significant re-rating of Indian equities, leading to explosive returns. In 1991 alone, the Sensex surged by over 90%, followed by an additional 33% gain in 1992, effectively more than doubling investor wealth in just two years. This era demonstrated how policy changes could drive substantial market gains beyond mere earnings growth.
Navigating Market Cycles
The period from 1996 to 1998 presented a more sobering picture, with negative returns in two out of the three years and modest gains in the positive year. The index traded within a range of 3,000 to 3,700 points, yielding lackluster compounded returns despite significant intra-year fluctuations. However, 1999 witnessed a spectacular rally, with the Sensex climbing over 63% in a single year, fueled by early technology-led optimism. This surge provided rapid wealth multiplication for investors entering the market that year. Unfortunately, this optimism proved fragile, as the index experienced three consecutive weak years from 2000 to 2002, giving back a substantial portion of the previous year's gains.
The most potent growth phase in the Sensex's history commenced in 2003. That year alone delivered returns exceeding 72%, followed by four consecutive years of robust double-digit and high double-digit gains. Between early 2003 and the end of 2007, the index soared from around 3,400 to over 20,000, representing a nearly six-fold increase and extraordinary compounded annual growth. This impressive run was abruptly halted by the global financial crisis of 2008, which inflicted the index's single worst annual return, a collapse of more than 52%, erasing half of investor wealth and temporarily disrupting long-term compounding.
The Maturing Market
The 2010s introduced a shift towards more moderate annual gains, punctuated by sharp negative years like 2011 and minor declines in 2015. While strong years such as 2014 and 2017 offered returns of over 30% and 28% respectively, these became exceptions rather than the rule. The pandemic years brought another reshaping of the narrative. Despite a sharp intra-year dip in early 2020, the Sensex finished the year with positive returns exceeding 15%. In 2021, returns accelerated further, with the index gaining nearly 22%. From 2022 onwards, returns entered a more mature phase, moderating to low double-digit and high single-digit annual gains. While the index levels surpassed 85,000 by the end of 2025, the percentage returns naturally moderated due to the challenge of compounding from a significantly larger base.
Corporate Endurance and Sectoral Evolution
Out of the original constituents, only seven companies—Hindustan Unilever, ITC, Larsen & Toubro, Mahindra & Mahindra, Reliance Industries, Tata Motors Passenger Vehicles, and Tata Steel—have remained part of the Sensex throughout its 40-year history. Their survival is a testament to continuous reinvention, recalibrating legacy businesses, embracing new ventures, and adapting to evolving economic realities. Reliance Industries, for instance, transformed from petrochemicals to telecom and retail, while Tata Motors Passenger Vehicles evolved significantly from its commercial vehicle origins. ITC diversified from tobacco, Hindustan Unilever focused on steady consumption growth, Larsen & Toubro adapted to investment cycles, Mahindra & Mahindra responded to rural demand shifts, and Tata Steel navigated commodity cycles through scale and consolidation.
Sectorally, the index has undergone a dramatic transformation. In 1986, manufacturing companies constituted 100% of the index. Today, financials dominate with 39%, followed by IT services at 12%, healthcare at 2%, Services at 2%, and manufacturing companies making up the remaining 45%. The current market capitalization of the Sensex stands at ₹169.37 lakh crore, representing 36% of the total market capitalization of all BSE-listed companies. Currently, the index trades at a Price-to-Earnings (PE) multiple of 23 times trailing 12-month earnings, having delivered approximately 8.5% return this year, marking the second consecutive year of single-digit returns, a contrast to its long-term CAGR.
Impact
This historical analysis offers profound insights for investors, highlighting the power of long-term compounding, the importance of adapting to market cycles, and the resilience required for corporate longevity. Understanding these dynamics can inform investment strategies and expectations. The sustained growth of the Sensex underscores India's robust economic trajectory and the potential for wealth creation in its equity markets. The evolution of its components reflects the changing landscape of the Indian economy itself.
Impact Rating: 8/10
Difficult Terms Explained
CAGR (Compound Annual Growth Rate): The average annual rate of return over a specified period longer than one year, assuming profits are reinvested.
Nominal GDP Growth: The increase in the total value of goods and services produced in a country, measured in current market prices, without adjusting for inflation.
Liberalization: The process of reducing government regulations and restrictions on businesses and markets to encourage economic activity.
Equities: Financial instruments representing ownership in a corporation, commonly known as stocks.
Portfolio: A collection of financial investments like stocks, bonds, commodities, and cash held by an individual or institution.
PE Multiple (Price-to-Earnings Ratio): A valuation ratio that compares a company's stock price to its earnings per share, indicating how much investors are willing to pay for each rupee of earnings.