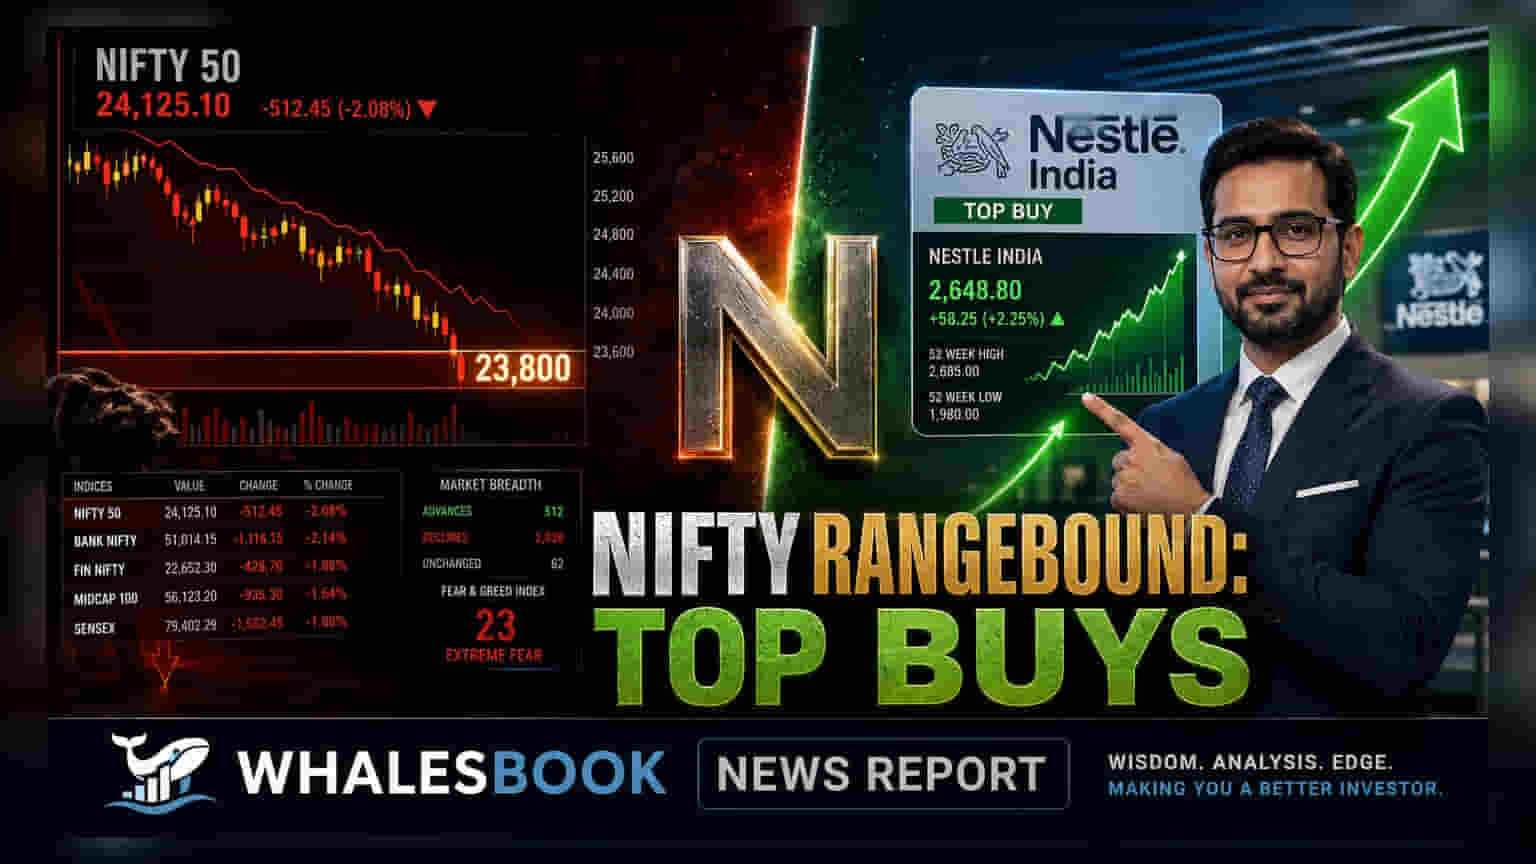
The Nifty 50 index snapped a three-day losing streak on Wednesday, closing 140 points higher as buying emerged near the 23,800 support level. Market analysts expect the index to consolidate between 23,800 and 24,200. Meanwhile, technical research has flagged Nestle India, HDFC AMC, and DLF for potential price momentum based on recent chart patterns.
What Happened
The Indian equity market saw a positive turn on Wednesday as the Nifty 50 index broke its three-day losing streak. The index gained 140 points, finding support near the 23,800 level. This movement formed a bullish chart pattern, which some analysts interpret as a sign that the downward pressure may be easing for now.
Market Outlook
Analysts are currently keeping a close watch on the trading range for the Nifty 50. The consensus view suggests that the index is likely to remain in a rangebound state between 23,800 and 24,200 in the coming sessions. For the market to show stronger upward momentum, traders are looking for a decisive move above the 24,050 mark, which could potentially push the index toward the 24,200 to 24,400 range.
The Bank Nifty index also saw some positive activity but remains in a phase of consolidation. Experts suggest a trading range for this sector between 57,000 and 58,500. While dips toward the 57,500 level are being viewed as potential buying opportunities by some market participants, a drop below the 57,000 mark could change the current technical structure.
Technical Views On Stock Picks
Market analysts have identified three specific stocks that are showing interesting chart patterns. These setups are primarily used by traders to identify potential price movement rather than reflecting long-term fundamental changes.
Nestle India has been noted for forming a base near its 40-day moving average. Analysts observe that the stock has moved out of a consolidation phase, with technical indicators like the MACD (a tool used to track momentum) showing a positive crossover.
HDFC Asset Management Company (HDFC AMC) is being tracked for a "pole and flag" chart pattern, which traders often associate with sustained momentum. The stock has seen support from trading volumes, and its Relative Strength Index (RSI)—a tool that measures if a stock is overbought or oversold—is currently above 60.
DLF Ltd. has been highlighted for an "Inside Bar" pattern breakout on weekly charts. In technical terms, this often suggests that the stock may continue its previous uptrend after a period of resting. Analysts have noted a positive signal from its MACD indicator as well.
Understanding Technical Risk
It is important to note that these stock views are based on technical analysis, which relies on historical price and volume data. These indicators do not predict the future and can fail if market conditions change suddenly. Investors should be aware that technical setups can be invalidated by broader market volatility, company-specific news, or global economic factors. While these patterns may signal interest, they are not a substitute for evaluating the company’s underlying financial health and long-term business prospects.