The Nifty 50 and Bank Nifty continue to show strength after gains on July 1. Investors are focusing on key support and resistance levels as the indices attempt to extend their upward trend. Understanding these zones can help assess whether the market maintains its momentum or faces potential profit-taking.
What Happened
Following a positive trading session on July 1, the Indian stock market is showing signs of continued momentum. The Nifty 50 index closed the day at 24,006, recording a gain of 140 points. Simultaneously, the Bank Nifty index saw a strong performance, closing at 58,033 after rising 490 points. Investors are now watching these indices closely as they enter new trading levels on July 2, keeping an eye on whether the bullish trend persists or encounters resistance.
The Market Trend
For stock market participants, indices like the Nifty 50 and Bank Nifty act as a pulse for the broader market. When an index trades above its recent average price levels, it often suggests that market sentiment is positive. However, indices rarely move in a straight line. As they approach higher levels, they often meet 'resistance'—a point where sellers might step in to book profits. Conversely, 'support' levels are areas where buyers historically tend to step in, preventing the index from falling further. Recognizing these levels helps investors understand the current risk-reward landscape.
Key Levels To Track For Nifty
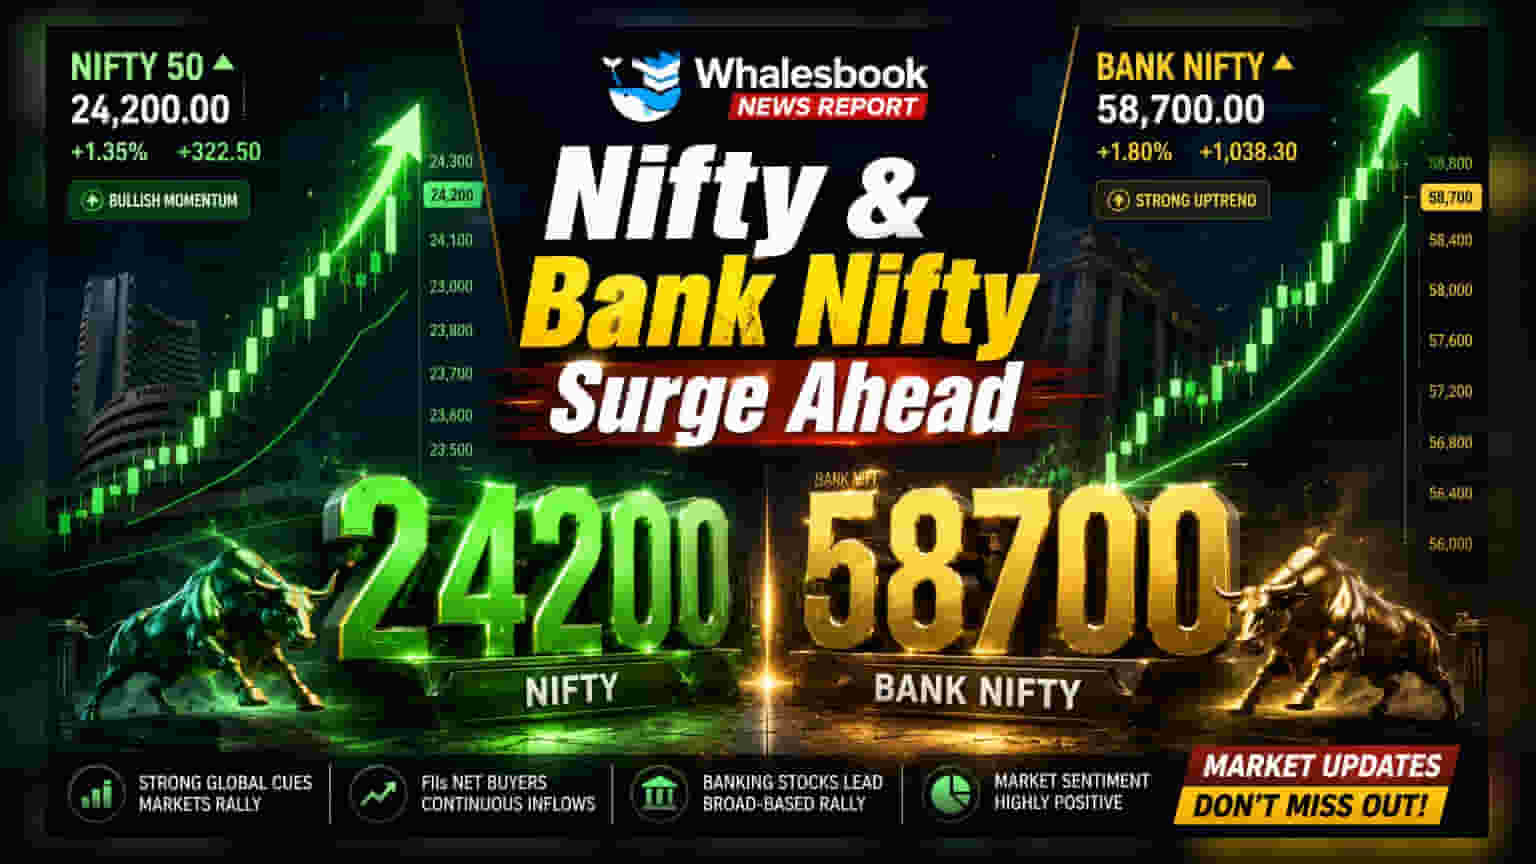
The Nifty 50 index is currently aiming to move past the 24,200 mark. If it successfully stays above this level, the index could potentially test higher ranges like 24,500 to 24,600. On the downside, market participants are looking at the 23,900 to 23,850 band as a crucial support zone. If the index falls below these levels, it may seek further support near 23,800 and 23,700.
Bank Nifty’s Important Zones
The Bank Nifty has shown strong performance compared to the benchmark Nifty, keeping investors optimistic. For today's session, the index is expected to face a significant test between 58,500 and 58,700. These are the immediate resistance levels where the index might see some selling pressure. On the flip side, the index has a vital support level at 57,500. A move below this point could shift the sentiment, making the 57,400 level the next point of interest for market observers.
What Investors Should Monitor
While technical levels provide a framework, market movement depends on several moving parts. Investors should track the sustainability of the price moves, specifically whether the indices can hold their gains throughout the trading session. Trading volume is another important indicator; high volume alongside price gains often confirms the strength of a trend. Additionally, monitoring sector-specific news and global cues remains essential, as these often influence the direction of both Nifty and Bank Nifty. For long-term investors, index levels serve as a guide to market health rather than an indicator for short-term entry or exit.