

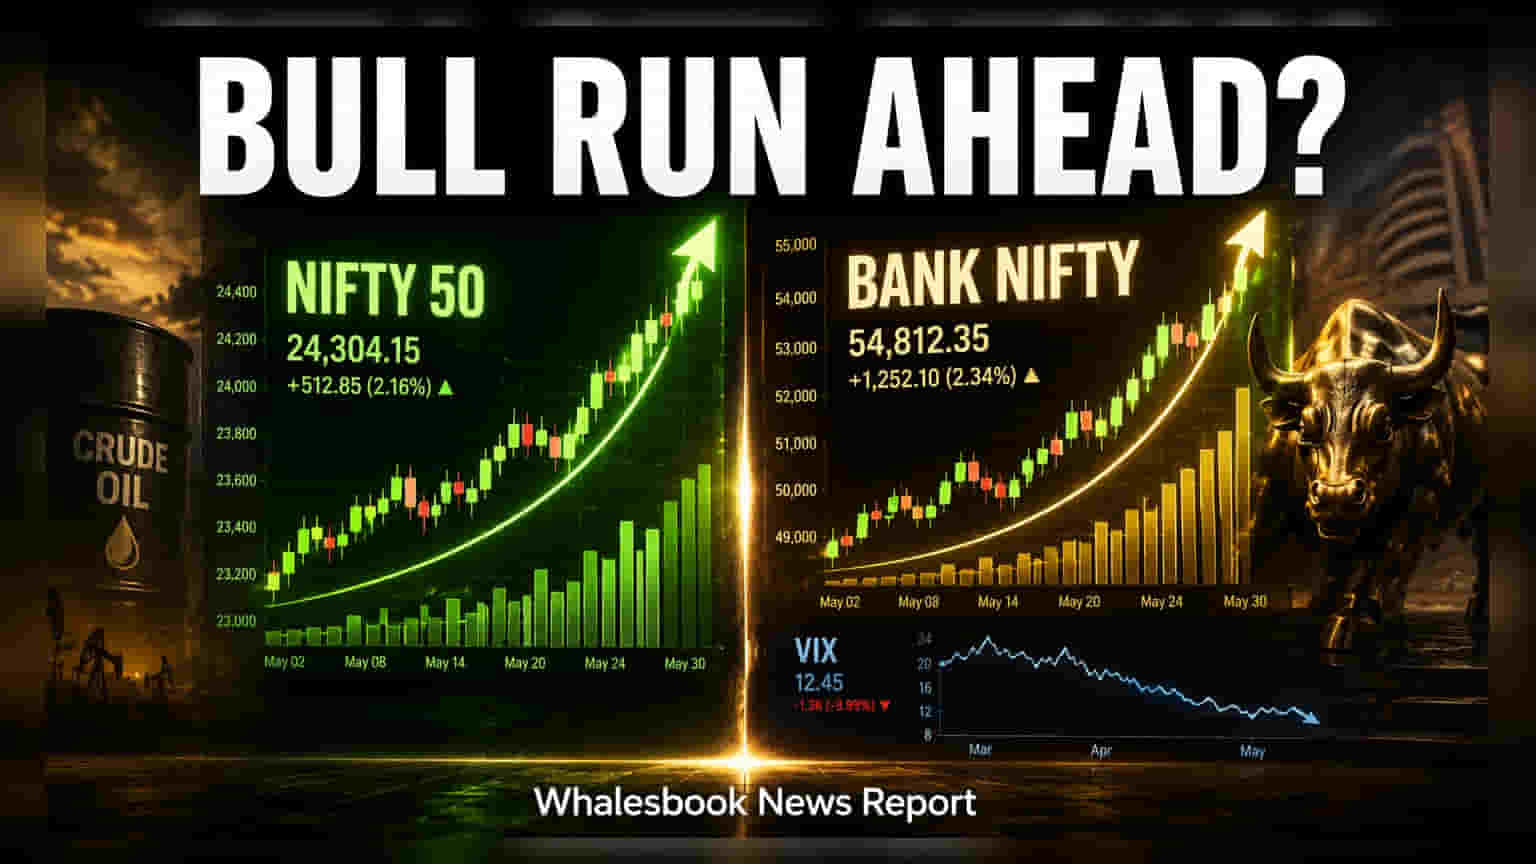
Indian markets show signs of recovery as cooling oil prices and lower volatility support positive sentiment. The Nifty 50 faces immediate resistance near 24,200, while the Bank Nifty eyes a breakout above 58,700. Investors are watching these technical levels closely as the market navigates a range-bound path.
The Indian equity market continues to exhibit resilience, with the Nifty 50 and Bank Nifty showing a constructive trend following a steady performance on July 9. The current market environment is receiving support from the easing of crude oil prices and a decline in the India VIX, a key metric that tracks market expectations of volatility. Lower volatility often suggests that investors are more comfortable with the current price levels, reducing sudden swings.
Nifty 50 Technical Levels
The Nifty 50 index, which closed at 23,963, is currently navigating a specific trading range. For market participants, the area between 24,100 and 24,200 acts as a significant hurdle where selling pressure has historically emerged. On the downside, the 23,800 level remains a firm support zone. Current technical data shows the Relative Strength Index (RSI) approaching the 50 mark. This indicates that while the overall trend remains stable, the rapid upward momentum seen in previous sessions has cooled, leading to expectations of a range-bound movement within the 23,800 to 24,400 band.
Bank Nifty Performance
Bank Nifty has demonstrated a relatively firmer structure compared to the broader Nifty 50, supported by its positioning above key moving averages. The index closed with a notable gain of 510 points at 57,252. To witness a sustained upward movement, the index needs to decisively breach the 58,700 mark. Until this breakout occurs, the banking index is expected to trade within a consolidation zone, with support identified at 56,300. The positive trend in banking stocks is currently being tested by the index's ability to maintain these levels without slipping back into a wider consolidation phase.
Market Outlook and Investor Context
In the current market phase, technical indicators are becoming the primary tool for many traders to gauge direction. The reliance on specific resistance and support levels highlights that the market is waiting for a clear catalyst to break out of its recent range. Investors monitoring these movements should note that macroeconomic factors, such as energy costs and domestic policy updates, often play a role in whether these technical levels hold or break. While the market is showing stability, the lack of strong directional conviction means that movements are likely to be sensitive to incoming global and local financial data. The next important step for the indices will be to see if they can clear their respective resistance levels on higher trading volumes, which would signal a more sustained trend rather than temporary strength.