

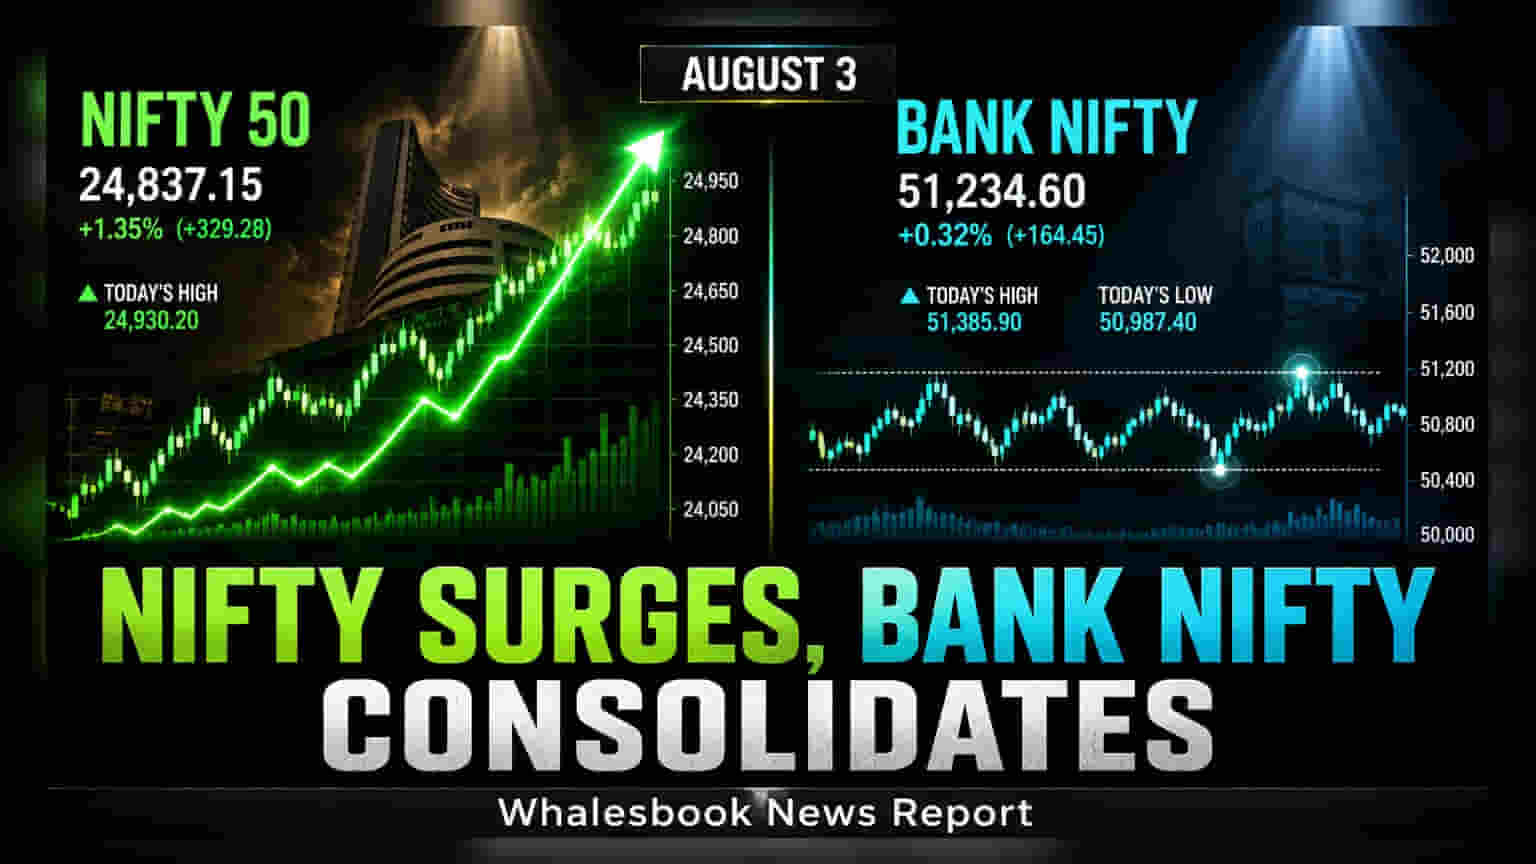
The Nifty 50 has shown consistent gains, finishing the week above its 200-day Exponential Moving Average at 24,370. Market participants are now monitoring the 24,600 mark as a potential resistance level. Lower market volatility is currently supporting positive sentiment as traders look for further upward movement.
The Indian equity market concluded the week on a positive note, with the Nifty 50 index marking a notable recovery. The index has posted gains in four out of the last five trading sessions, reflecting a shift in investor sentiment. On July 31, the Nifty 50 rose by 0.27 percent, extending its total gain to 2.6 percent since its recent low on July 24.
Technical Indicators and Support Levels
The index is now trading above its 200-day Exponential Moving Average (EMA) of 24,370. This moving average is a widely followed technical tool used by traders to identify long-term trends. By holding above this level, the Nifty 50 has established a higher high and higher low pattern over the past five days. With the Relative Strength Index (RSI) at 59.21, momentum indicators show improving strength. Investors are now focusing on the 24,500 to 24,600 zone, which corresponds to previous swing highs. If the index sustains this upward momentum, it may target 24,800 to 25,000, provided that the support zone between 24,000 and 24,100 remains stable.
Bank Nifty Performance and Resistance
While the broader Nifty 50 has shown clear signs of strength, the Bank Nifty remains in a phase of transition. The index recorded modest gains and formed a bullish candle on its daily chart, but it continues to face pressure near its 20-day and 100-day moving averages. To confirm a sustained uptrend, the Bank Nifty requires a decisive close above its 20-day EMA, currently positioned near 57,282. Additionally, the index is encountering resistance at the 23.6 percent Fibonacci retracement level, which often acts as a hurdle during market recoveries.
Market Volatility and Options Activity
Market stability appears to be improving, as evidenced by the India VIX. The volatility index fell by 3.29 percent to 11.755, its lowest level since July 7. A lower VIX typically indicates a more stable market environment. In the options market, high open interest at the 24,600 strike price for Nifty calls suggests that traders view this as a significant resistance point. Conversely, the 24,000 strike shows maximum open interest on the put side, reinforcing its role as a crucial support level. The Nifty Put-Call Ratio (PCR) has risen to 1.39, which reflects a preference among traders to sell puts and buy calls, generally viewed as a positive sign for market direction. The key monitorables for the coming week will be whether the Nifty 50 can maintain its position above 24,370 and if the Bank Nifty can successfully break past its immediate resistance levels.