

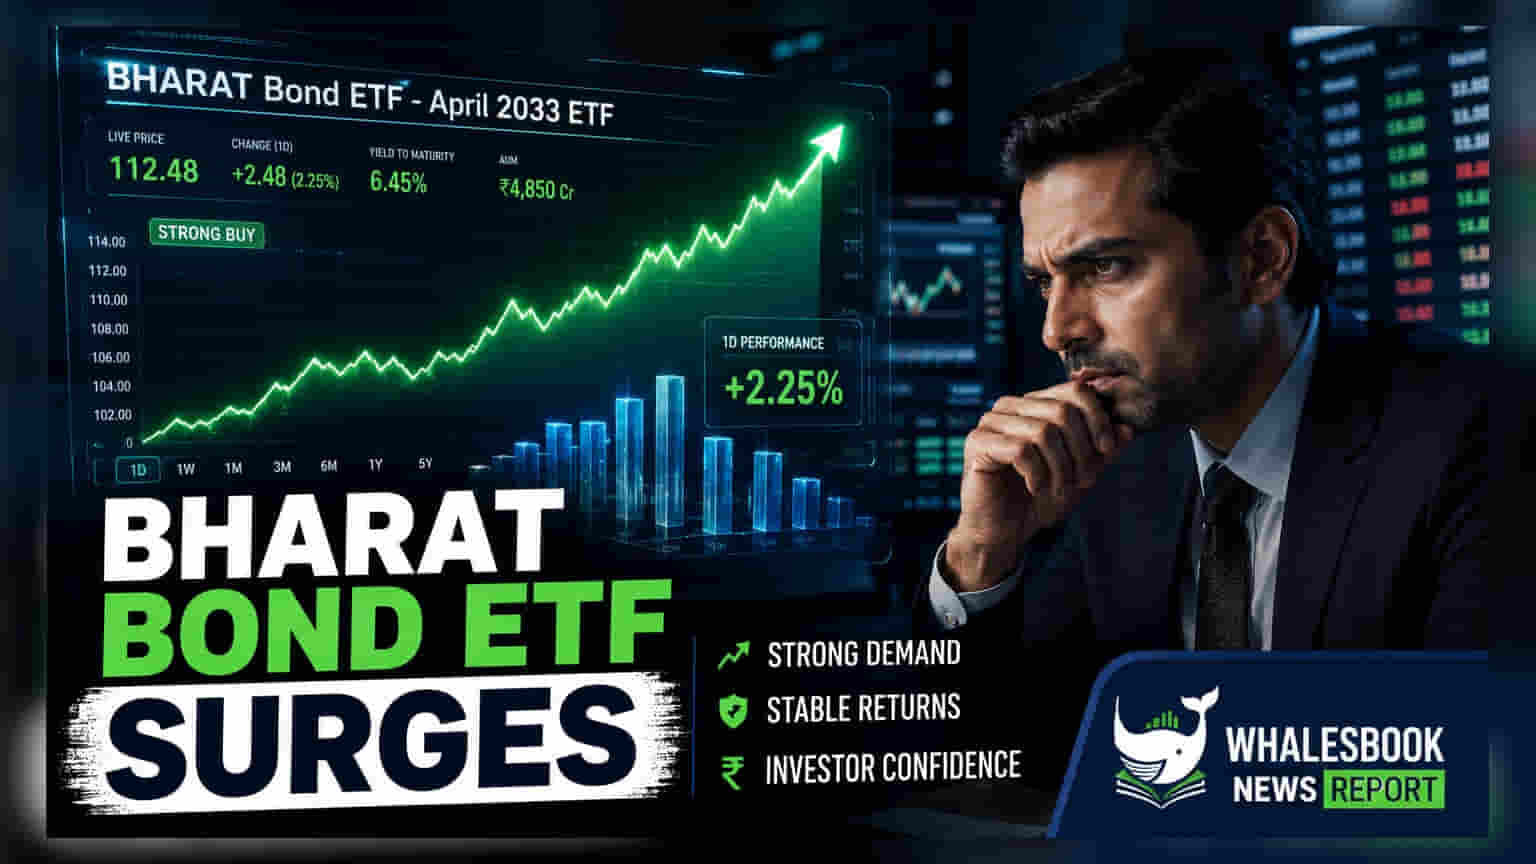
The BHARAT Bond ETF - April 2033 has emerged as the top debt ETF performer, delivering 3.1% returns over the past six months. This series and others like the April 2032 and 2031 funds have consistently outperformed their benchmarks. Investors should analyze these funds across multiple timeframes to understand their stability and performance relative to specific debt market maturity goals.
The BHARAT Bond ETF series has demonstrated solid performance in the Indian debt market, with the April 2033 maturity fund securing the top position in the debt ETF category over the last six months. As of early July 2026, this fund delivered a return of 3.1%, outpacing several peers in the fixed-income segment. Other variants, such as the BHARAT Bond ETF - April 2032 and April 2031, also showed strong momentum, recording returns of 3.1% and 3.0% respectively during the same period.
Asset Size and Market Liquidity
Beyond individual returns, the size of these funds is a notable factor for investors monitoring liquidity. The BHARAT Bond ETF - April 2030 currently holds the largest corpus among the top five debt ETFs, with Assets Under Management (AUM) reported at Rs 24,859.9 crore. For investors, a larger AUM often suggests higher trading volumes and ease of entry or exit on the exchange, which is a practical consideration for those managing debt portfolios.
Performance Against Benchmarks
When evaluating the consistency of these ETFs, the April 2033 series has shown an ability to beat its underlying benchmark. On a one-year horizon, the fund recorded a 5.3% return, which is 3.0 percentage points higher than its benchmark. Over a three-year period, it delivered 7.9%, exceeding its benchmark by 1.0 percentage point. This performance pattern suggests that the strategy employed by the fund management has been effective in navigating the interest rate environment.
Understanding Performance Across Timeframes
Investors should note that leadership among these ETFs fluctuates depending on the time horizon. While the April 2033 fund leads over a six-month duration, other funds take the lead in shorter or longer windows. For example, the BHARAT Bond ETF - April 2032 outperformed in the one-month return category with 3.1%. Meanwhile, the Nippon India ETF Nifty 8-13 yr G-Sec Long Term Gilt topped the three-month performance chart with 4.1%.
This shift in leadership is common in debt instruments, as different maturity profiles react differently to changes in government bond yields and overall interest rate trends in the economy. Because these ETFs invest in underlying bonds with specific maturity dates, their price movements are closely linked to the prevailing interest rate environment. Investors often monitor these funds to align with their specific time horizons, as holding until maturity helps mitigate the impact of short-term price volatility. The next important step for investors is to review how these funds perform as they approach their respective maturity years and to track the interest rate cycles that influence the overall bond market.