The UTI Nifty 50 Index Fund has recorded a 9.7% three-year CAGR, leading other Nifty 50 index funds with over ₹1,500 crore in assets. While the fund leads the peer group, it has trailed its benchmark index, highlighting the importance of tracking error for investors choosing passive funds.
What Happened
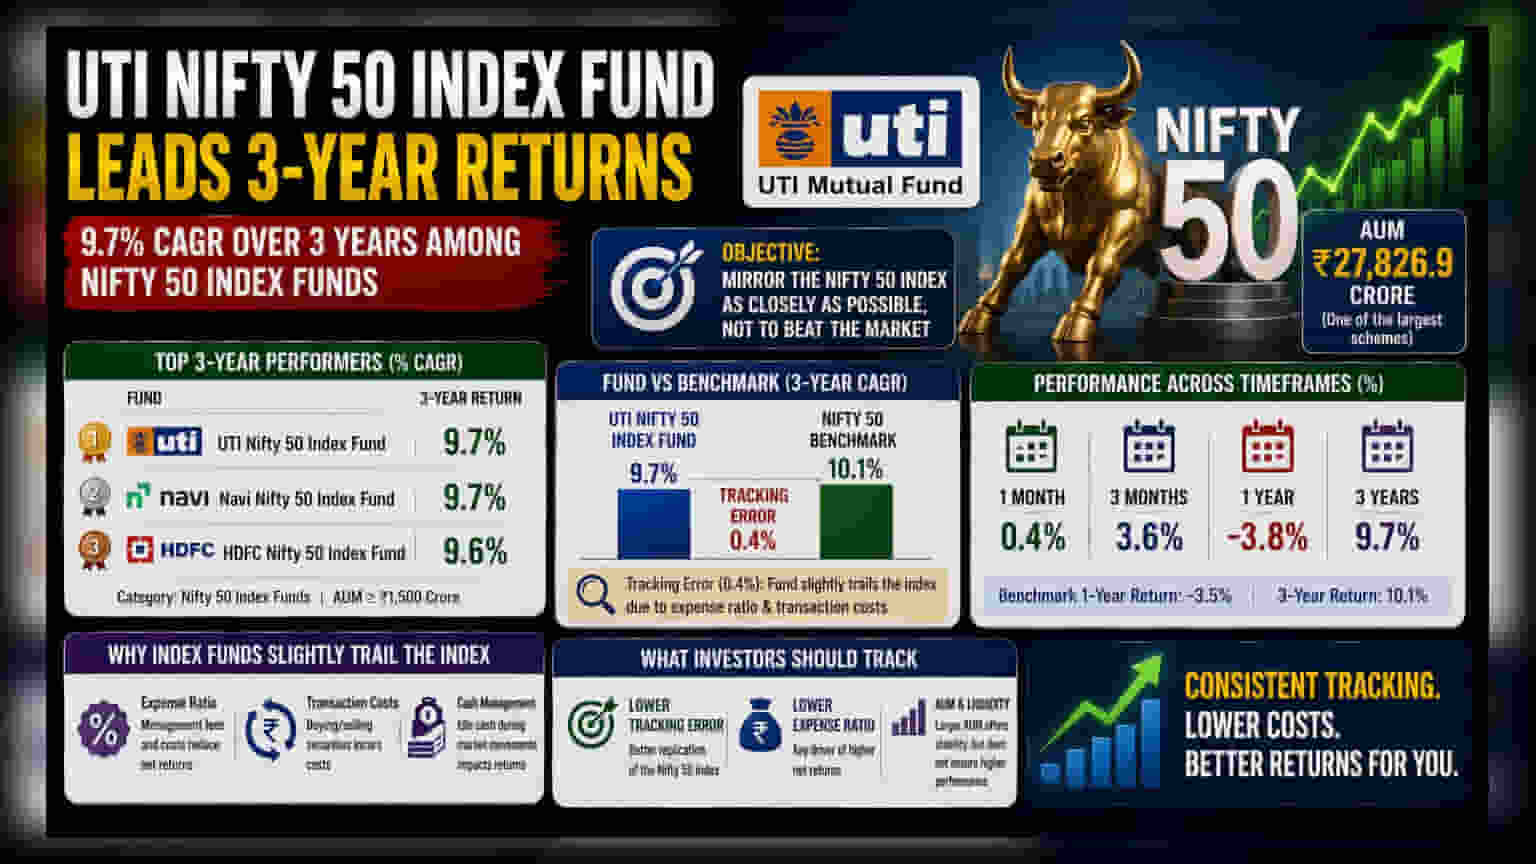
The UTI Nifty 50 Index Fund has emerged as the leading scheme in its category, recording a 9.7% three-year compound annual growth rate (CAGR). According to data from ACE MF as of June 25, 2026, the fund outperformed several peers in this specific period. The Navi Nifty 50 Index Fund followed with a 9.7% return, while the HDFC Nifty 50 Index Fund posted a 9.6% return.
This analysis considers funds with at least ₹1,500 crore in assets under management (AUM). Among these, the UTI Nifty 50 Index Fund maintains a significant presence with a corpus of ₹27,826.9 crore, making it one of the larger schemes in the category.
The Gap Between Fund and Benchmark
While the fund leads the peer ranking, investors should look closer at the difference between the fund’s return and the actual Nifty 50 index return. Over the last three years, the Nifty 50 benchmark itself achieved a return of 10.1%. The UTI Nifty 50 Index Fund, by comparison, delivered 9.7%.
This gap—roughly 0.4 percentage points—is a common feature in index funds. It is known as 'tracking error.' An index fund's goal is not to beat the market, but to mirror the index as closely as possible. Because the fund has to pay management fees and transaction costs, it will almost always slightly trail the index it tracks. The lower this gap, the more efficiently the fund is tracking the index.
Understanding Performance in Index Funds
For active equity funds, investors look for managers who can 'beat the market.' However, for passive products like Nifty 50 Index funds, the objective is different. Since all funds in this category are buying the same 50 stocks in the same proportion, they should technically provide identical returns.
Differences in returns arise primarily from two factors: the expense ratio (the fee the fund house charges) and how well they manage cash during market movements. A fund that charges a lower fee will typically have a smaller tracking error, leading to returns that are closer to the benchmark index. Investors often prioritize funds with the lowest expense ratios in this category, rather than just historical return rankings, because lower costs compound into better long-term results.
Short-Term Trends
Looking at shorter timeframes, the UTI Nifty 50 Index Fund showed a 0.4% return over one month and a 3.6% gain over three months. Over the past one year, the fund returned -3.8%, which was slightly behind the benchmark's movement. These short-term fluctuations are common in equity indices and generally reflect the underlying volatility of the Nifty 50 stocks themselves.
What Investors Should Track
When evaluating index funds, returns are just one part of the story. Investors should look at the following monitorables:
- Tracking Error: A lower tracking error indicates that the fund is closely mimicking the Nifty 50 index.
- Expense Ratio: Since these funds do not have the goal of beating the market, lower costs are the primary way a fund can deliver better net returns for investors.
- Asset Under Management (AUM): While larger AUM provides stability and liquidity, it does not guarantee higher performance in index funds, as the strategy is purely passive replication of the index.