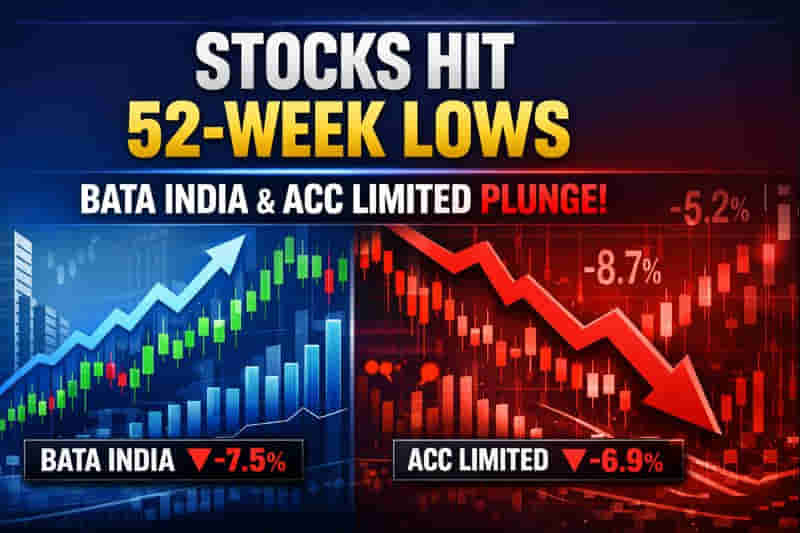
Stocks Hit 52-Week Lows Amidst Market Rally
Wednesday saw a significant divergence in the Indian stock market as thirteen stocks from the Nifty 500 index touched new 52-week lows. This occurred while the broader market indices, the BSE Sensex and NSE Nifty, were trading near their all-time highs, signaling underlying weakness that is not reflected in the benchmark performance. Prominent companies among those hitting lows include ACC Limited, Bata India Limited, Rural Electrification Corporation Limited (RECL), and HFCL Limited.
Weak Participation Beneath the Surface
Analysts point out that this phenomenon highlights a lack of broad-based participation in the market rally. Aakash Shah, Technical Research Analyst at Choice Equity Broking, commented that even as benchmark indices showed strength, these prominent stocks were nearing their yearly lows, indicating a concerning trend beneath the surface. The fact that these stocks are hitting lows while the overall market is strong suggests that many individual companies are struggling despite the positive sentiment in broader indices.
Financial Implications and Steep Declines
A 52-week low signifies sustained selling pressure and indicates that a stock has been out of favor technically. Currently, these thirteen stocks have seen substantial drops, with some declining by as much as 61% from their respective 52-week highs. Cohance Lifesciences Limited experienced the most significant fall, tumbling 60.8% from its high of ₹1,328.20. Other notable decliners include Nagarjuna Construction Company Limited (NCC), Ramkrishna Forgings Limited, and HFCL Limited, all plunging around 50% from their peaks. RECL has dropped nearly 41%, while Bata India Limited and BASF India Limited have fallen around 35% each.
Technical Indicators Signal Weakness
Technically, these stocks are trading below key short-term and long-term moving averages, confirming a weak primary trend according to Aakash Shah. He noted that ACC Limited, Bata India Limited, RECL, and HFCL Limited are testing important monthly support zones. However, Shah cautioned that testing support levels alone does not constitute a buy signal, emphasizing the need for further price action confirmation.
Analyst Recommendations and Trading Strategy
From a trading perspective, Aakash Shah strongly advises against 'bottom-fishing,' a strategy of buying stocks that have fallen significantly in anticipation of a bounce. Instead, he recommends a 'wait and watch' approach. Investors should consider buying only after a clear trend reversal is confirmed, typically indicated by the formation of higher highs and higher lows on the charts. This strategy aims to mitigate risks associated with catching a falling knife.
Individual Stock Insights
ACC Limited is approaching a strong long-term support zone between ₹1,700 – ₹1,750. While this area has historically acted as a demand zone, the stock is in a corrective phase, with resistance expected around ₹2,000 – ₹2,100. Trend stabilization and a strong monthly close are prerequisites for fresh buying.
Bata India Limited is testing a key monthly support band near ₹890 – ₹900 following a prolonged downtrend. Although this zone might trigger a technical bounce, resistance is anticipated at ₹1,100 – ₹1,150. The overall structure remains weak until the stock establishes higher lows on its monthly chart.
Rural Electrification Corporation Limited (RECL) is near a crucial monthly support zone around ₹330 – ₹325, coinciding with its previous breakout area and its 200-day Exponential Moving Average (EMA). Immediate resistance is seen near ₹390 – ₹420. Holding above the support level is critical, and a sustained move above resistance is needed to signal a trend reversal.
HFCL Limited is trading close to a long-term accumulation zone between ₹62 – ₹61 on its monthly chart. However, the stock exhibits volatility, facing strong resistance near ₹80 – ₹85. A confirmed break above this resistance on a monthly closing basis is required to confirm a positive setup, otherwise, the risk remains high.
Impact
This news indicates potential risks for investors holding these stocks, suggesting that a broad market rally might not benefit all companies equally. The prevalence of 52-week lows among Nifty 500 components signals that a significant number of individual stocks are underperforming, which could lead to portfolio value erosion for investors not diversifying or selecting carefully. It suggests that sentiment may not be as robust as headline indices suggest. Impact rating: 7/10.
Difficult Terms Explained
- Nifty 500: A stock market index representing the top 500 companies listed on the National Stock Exchange of India (NSE), reflecting the broad market performance.
- 52-week low: The lowest price at which a stock has traded during the preceding 52 weeks (one year).
- Benchmark indices: Stock market indexes, such as the BSE Sensex and NSE Nifty, that are used to represent the overall performance of the market or a specific sector.
- Technical analysis: A method of evaluating securities by analyzing statistics generated by market activity, such as past prices and volume.
- Moving averages: A technical indicator that smooths out price data by creating a constantly updated average price. Common types include the 200-day moving average.
- 200-day EMA: A specific type of moving average (Exponential Moving Average) that gives more weight to recent prices and is calculated over 200 days. It is often used to identify long-term trends.
- Bottom-fishing: The practice of buying stocks that have fallen significantly in price, in the hope that they will rebound.
- Trend reversal: A change in the direction of a stock's price movement.
- Higher highs and higher lows: Chart patterns indicating an uptrend, where each successive peak and trough is higher than the previous one.
- Support zone: A price range where a stock has historically found buying interest, preventing further price declines.
- Resistance: A price level where selling pressure is expected to overcome buying pressure, potentially halting an upward price movement.
- Accumulation zone: A price range where investors are believed to be buying a stock steadily, often before a significant price increase.