

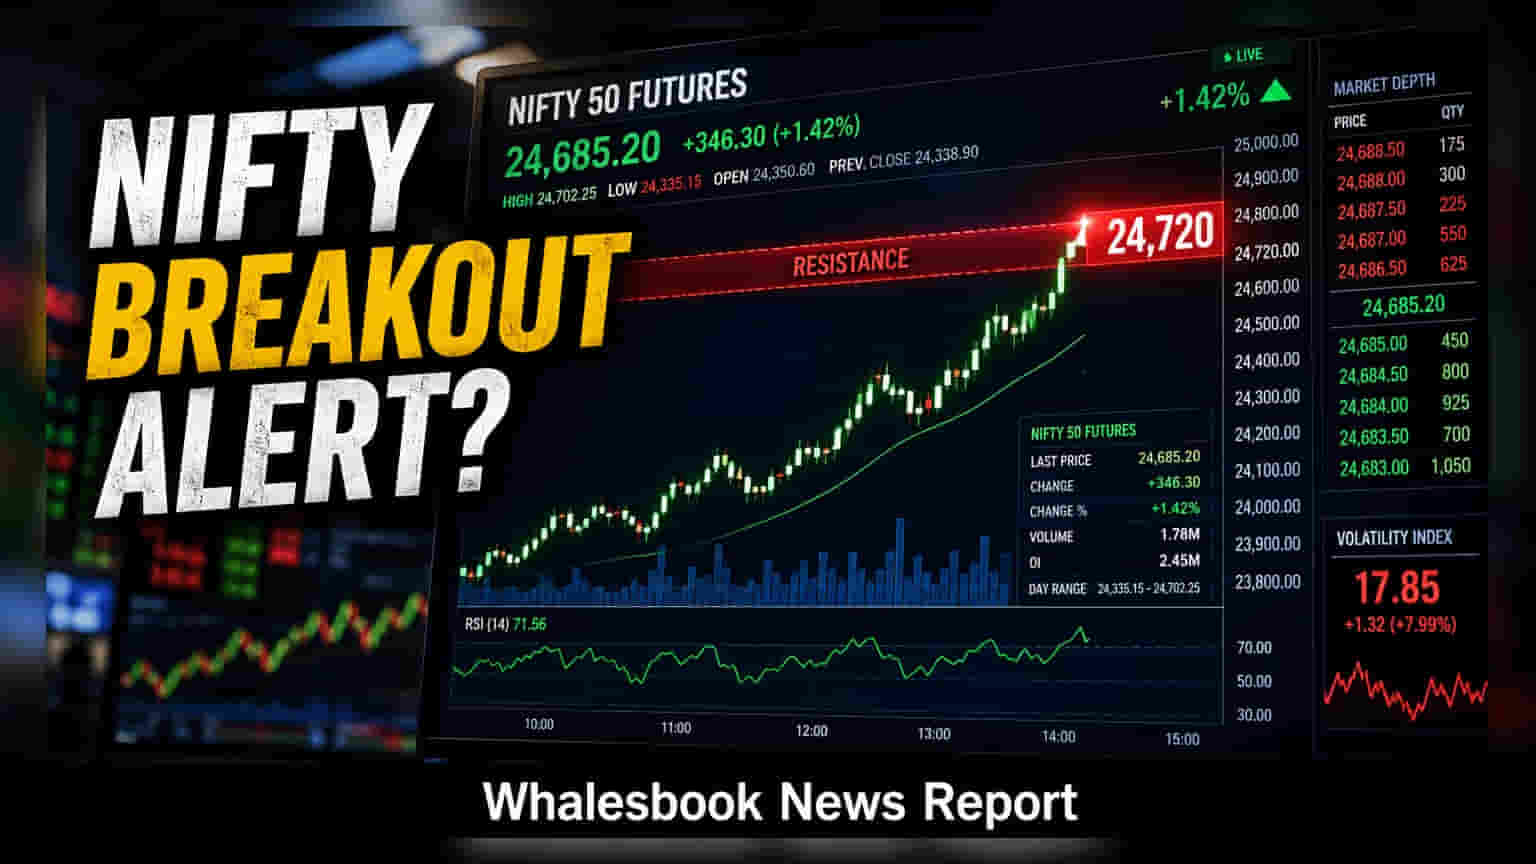
Nifty 50 futures are trading at 24,695 on August 4, 2026, showing a gain of 0.15% after finding intraday support. The index faces a key resistance level at 24,720, which determines the next potential momentum. Investors are tracking these levels as the market gauges short-term direction following an early session dip.
The Nifty 50 futures contract is displaying a resilient trend on August 4, 2026, trading at 24,695. This reflects a marginal gain of 0.15% from the previous close. The trading session began with an early dip, but the index managed to find intraday support near the 24,620 level, which has acted as a floor for price movement during the morning hours.
Monitoring Key Technical Levels
The immediate focus for market participants is the resistance level at 24,720. Historically, this point has represented a barrier for upward movement. A confirmed and sustained move above 24,720 would be a significant indicator for the index, potentially opening the path toward the 24,850 mark. Conversely, should the index fail to overcome this hurdle, traders are paying close attention to the 24,550 level, which serves as a critical support zone. If the index falls below this mark, it may signal a shift in the current short-term trend.
Market Context and Volatility
Indian equity indices have been navigating a period of range-bound activity as participants evaluate macroeconomic cues. While futures often reflect expectations for the spot Nifty 50 index, they are also influenced by institutional flows and shifts in global sentiment. The current behavior around the 24,700 zone suggests that traders are balancing cautious sentiment with hopes of a breakout.
For investors and active traders, the next important development will be how the index behaves if it touches the 24,720 resistance. A volume-supported breakout or a rejection from this level will provide clearer insights into the strength of the current rally. Market participants will also monitor any sudden changes in global indices or local economic data that could alter the index's trajectory as the week progresses.