Historical data shows the BSE Sensex has posted gains in 18 of the last 23 Julys, with an average return of 4.5%. As markets enter July, investors are focusing on upcoming April-June corporate earnings, monsoon progress, and institutional flow trends. Analysts are tracking key resistance levels on major indices to gauge further momentum.
What Happened
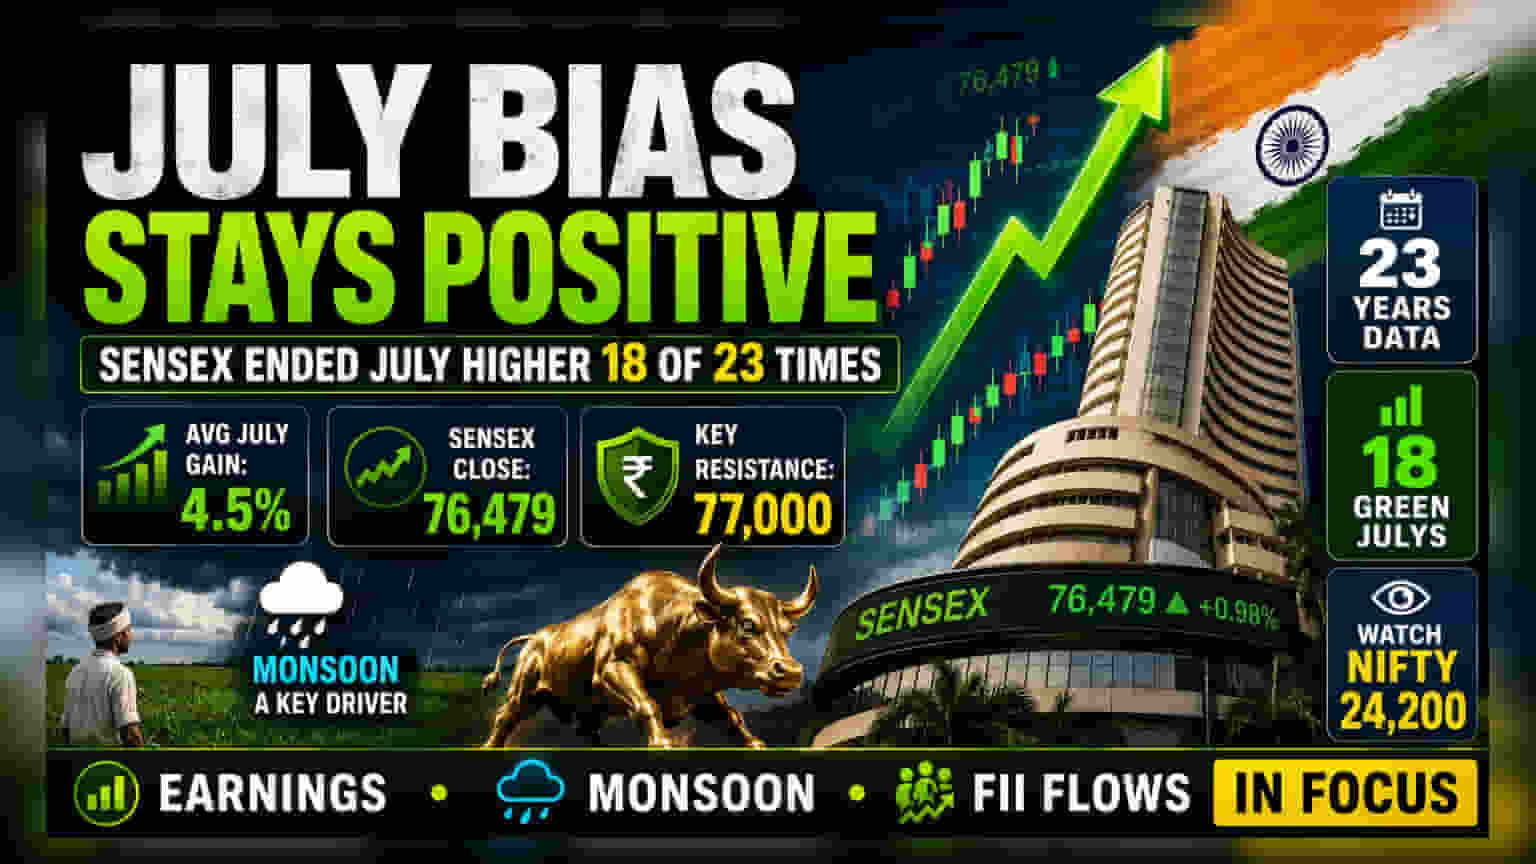
Indian stock markets are entering July with a positive historical backdrop. Data over the last 23 years shows that the BSE Sensex has ended the month in the green 18 times, recording an average gain of 4.5%. After the BSE Sensex closed June at 76,479, market participants are looking to see if this historical trend of strength will continue. While the index experienced a 1.7% dip from its monthly peak in June, the upcoming weeks are expected to be shaped by quarterly corporate earnings and the progress of the monsoon season.
The Historical July Trend
The track record for July has been generally favorable for Indian equities. Out of the past 23 years, only five Julys saw negative performance for the Sensex. Looking at the last 12 years specifically, negative returns were seen only twice—in 2019 and 2025. When the month has been positive, the performance has sometimes been strong; for example, the index recorded a gain of 8.6% in 2022 and 8.1% in 2009. However, historical data serves as a guide rather than a guarantee, as market conditions vary every year.
Key Drivers For The Month
Several factors typically influence market movement during July. The primary driver is the commencement of the April-June corporate earnings season. Investors pay close attention to company results and, more importantly, future guidance for the rest of the year.
Additionally, the progress of the monsoon remains a critical variable. A good monsoon season typically supports rural demand and helps control food inflation, which in turn influences interest rate expectations and overall market sentiment. Institutional activity also plays a part; data from NSDL shows that Foreign Portfolio Investors (FPIs) have been net buyers in Indian equities in nine of the last 12 Julys, while domestic mutual funds have recorded net buying in ten of those years.
Critical Levels To Watch
Analysts are keeping a close eye on technical resistance levels as the market attempts to maintain momentum. For the BSE Sensex, significant resistance is noted around the 77,000 mark. A successful move above this level could potentially open the path toward 77,500-77,700. On the downside, a fall below the 50-day Simple Moving Average (SMA), which sits near 76,300, might lead to increased selling pressure, with potential support levels near 75,800 and 75,500.
Similarly, regarding the Nifty, some analysts are looking at the 24,200 level as a key resistance point. Breaching this could suggest room for further upside, although global and domestic factors will ultimately dictate the pace.
What Investors Should Track Next
Investors may monitor a few specific developments throughout the month. First, the quality of April-June corporate earnings will be essential to validate market valuations. Second, updates on monsoon coverage across key agricultural regions will be vital for rural-focused sectors. Finally, watching the net buying or selling trends of FIIs and domestic institutions will provide insight into market liquidity and sentiment. Monitoring these factors alongside key resistance levels on the Sensex and Nifty will help in understanding the market's direction.