A Structural Shift in Measurement
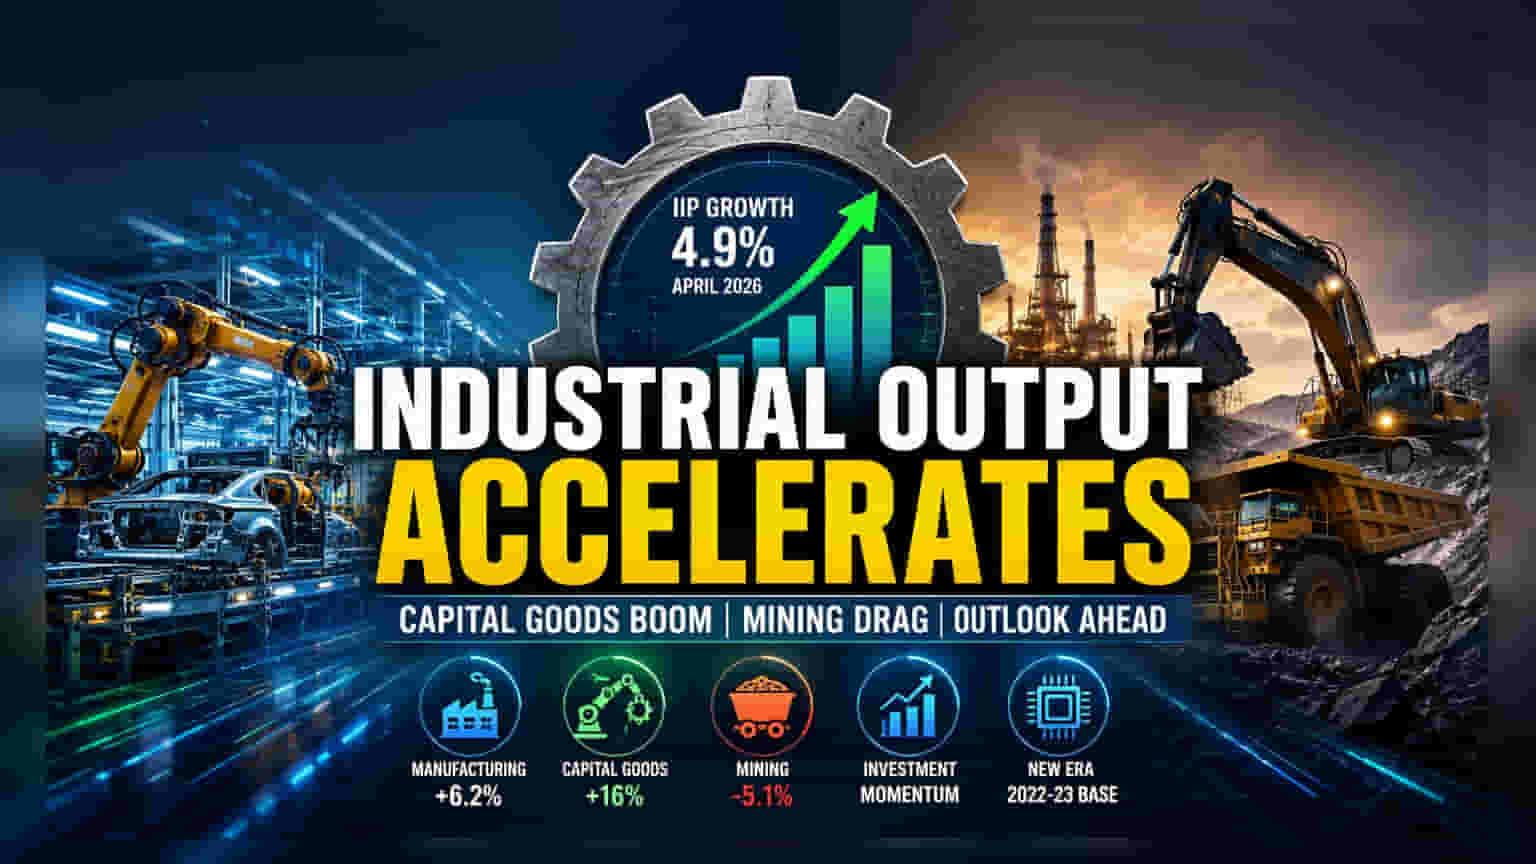
The latest industrial output figures for April 2026 arrive with a significant methodological transformation. The government has migrated the base year for the Index of Industrial Production (IIP) to 2022-23, effectively replacing the aging 2011-12 series. This update expands the item basket to 463 groups—including high-growth areas like specialized electronics, medical stents, and aerospace components—to better mirror the country's evolving economic complexity. Consequently, the 4.9% year-on-year growth rate must be viewed through the lens of this more granular, technology-oriented framework.
The Capital Goods Catalyst
The most striking feature of the new data is the sustained strength of the capital goods segment, which surged 16% in April. This marks the sixth consecutive month of double-digit expansion, signaling that the ongoing cycle of domestic capacity creation remains firmly entrenched. This performance is largely decoupled from the broader slowdown in primary goods. Industrial investment, incentivized by long-term policy frameworks and substantial public capital expenditure, is effectively neutralizing the impact of global supply chain volatility. Manufacturing, now carrying a refined weight of 76.1% in the index, drove the headline performance with a 6.2% increase, bolstered by strong output in electrical machinery and automotive components.
The Mining Drag
Despite the resilience of factory output, the mining and quarrying sector represents a structural vulnerability. A 5.1% contraction in April serves as a friction point, reflecting ongoing challenges in resource extraction and supply synchronization. Analysts note that this shortfall in the primary sector acts as a drag on the overall index, suggesting that while manufacturing is scaling, it remains reliant on stable energy and raw material inputs—areas currently susceptible to the ripple effects of West Asia's geopolitical instability. This disconnect highlights an economy currently operating with uneven momentum, where manufacturing efficiency is partially offset by persistent resource-side bottlenecks.
Risk Factors and Future Outlook
The primary concern for the remainder of the quarter is the transition from energy supply shocks to persistent price shocks. With fuel and transport costs elevated, corporate margins face continued pressure. While the manufacturing sector has displayed an impressive ability to absorb these costs thus far, the divergence between the capital goods boom and the mining contraction indicates that firms are expanding selectively. Market participants should remain cautious of the June monetary policy stance; any indication of restrictive liquidity could disproportionately impact the smaller, mid-cap firms currently fueling the manufacturing surge. The economy remains a study in contrasts: high-tech industrial capability is rising, yet it remains anchored to an energy-intensive industrial base that is struggling to keep pace.