

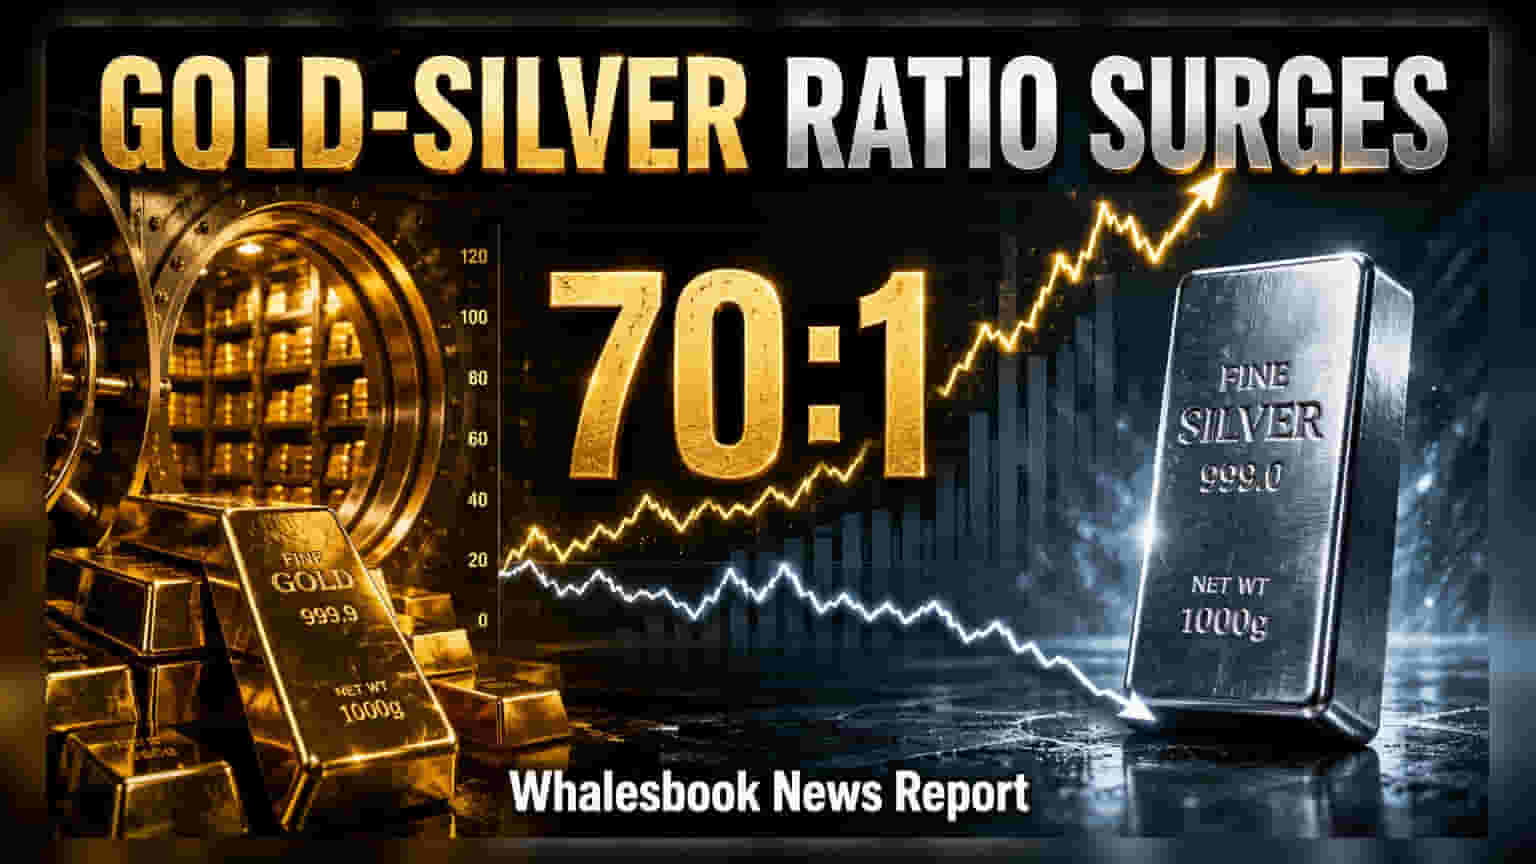
The gold-silver ratio has reached 70.34, suggesting silver is relatively cheaper than gold. This metric helps investors decide between gold's stability and silver's industrial-linked growth potential in the current market environment.
The gold-silver ratio, a key metric used to compare the prices of the two precious metals, has climbed to 70.34 as of July 29, 2026. This figure represents the number of ounces of silver required to purchase one ounce of gold. The shift from lower levels earlier this year, such as 55 in May and 50 in January, indicates that silver has underperformed relative to gold in recent months.
Understanding the Ratio
When the gold-silver ratio rises, it typically signals that silver is becoming cheaper compared to gold. Investors often use this ratio to gauge market sentiment toward precious metals. Gold is primarily viewed as a store of value and a safe-haven asset, which tends to attract more capital during times of geopolitical uncertainty or financial market volatility. In contrast, silver carries a dual nature, functioning both as a precious metal and an industrial commodity. Its price is often heavily influenced by manufacturing demand from sectors like electronics, solar energy, and automotive production.
Factors Driving Price Movements
Silver prices in the Indian market have held steady above ₹2 lakh per kilogram since December 2025, with MCX data showing trading levels above ₹2,17,800 per kilogram as of July 29, 2026. While both metals have seen significant interest, gold’s recent outperformance has been driven by its role in wealth preservation. Analysts indicate that if the U.S. Federal Reserve shifts toward easier monetary policy and global manufacturing activity strengthens, silver could see a resurgence. Increased industrial consumption combined with higher investor risk appetite are often the primary drivers that help silver close the performance gap with gold, which could pull the ratio back toward the 60 to 65 range.
Risks and Market Outlook
Investors should be aware of the inherent differences in these assets. Silver is historically more volatile than gold, meaning its price can experience sharper swings in both directions. For those prioritizing capital protection and lower volatility, gold remains the traditional choice. Aggressive investors often look at silver for its potential to outperform in the later stages of a bull market, though this strategy carries higher risk if industrial demand weakens or global economic growth slows down. Market experts currently expect the ratio to fluctuate between 65 and 75 in the near term. The final direction of this ratio will likely depend on future updates regarding interest rate policies, inflation data, and the strength of the manufacturing sector. Monitoring these macroeconomic triggers will be the most important step for investors planning to adjust their exposure to precious metals.