

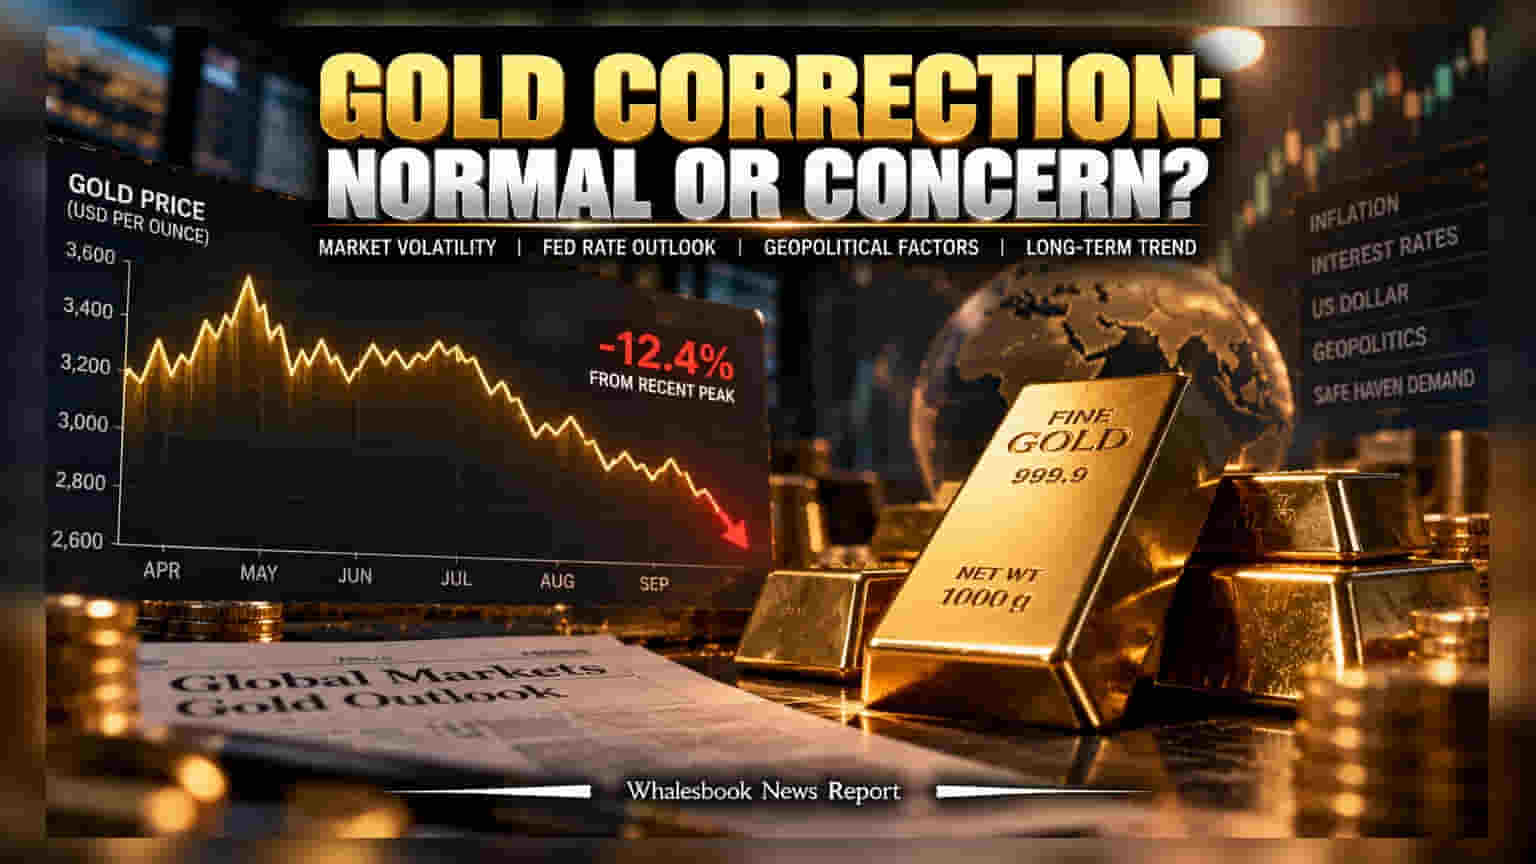
Gold prices have retreated from recent highs, causing uncertainty among investors. However, historical data shows that double-digit price dips are a standard feature of gold’s long-term journey. Understanding this volatility helps distinguish between temporary noise and significant trend reversals.
Gold prices have recently cooled off from the peaks seen in August, leading to questions about whether the metal's upward trend is ending. While any price drop can cause worry for those holding the asset, market history suggests that such volatility is a standard part of gold's journey rather than an exception.
Historical data going back to 1980 shows that gold frequently experiences intra-year pullbacks. On average, the metal sees a drawdown of about 13 percent within a calendar year. This pattern of rising prices followed by a correction is a common feature of how gold finds its price level, rather than necessarily being a sign of a structural break in the asset's long-term value.
The gap between a mid-year drop and the final year-end return is often wide. In many instances where gold faced double-digit declines during the year, it still managed to end with positive gains. During turbulent periods like 2008 and 2020, gold saw significant mid-year drops but eventually finished the year with double-digit growth. This history serves as a reminder that short-term price movements are often just noise within a larger trend.
However, the current price action is also tied to specific global factors. Investors are closely watching the US Federal Reserve’s interest rate policies, which strongly influence the value of the US dollar. Since gold is globally priced in dollars, a stronger currency often puts pressure on the metal's price. Additionally, geopolitical developments continue to play a major role in investor sentiment. When geopolitical tensions appear to cool, the demand for gold as a safe-haven asset can sometimes soften, adding to the current price volatility.
For investors, the risk lies in potential downside if the metal fails to hold its established support levels. While history shows that corrections are common, a prolonged break below key technical support zones could signal a shift in the broader market trend.
Moving forward, the primary factors for investors to track will be global economic data. Indicators such as US inflation reports, central bank decisions on interest rates, and ongoing changes in geopolitical stability will likely drive the next moves in gold prices. Keeping an eye on these developments helps in understanding whether a correction is a temporary dip or a sustained shift in the market environment.