

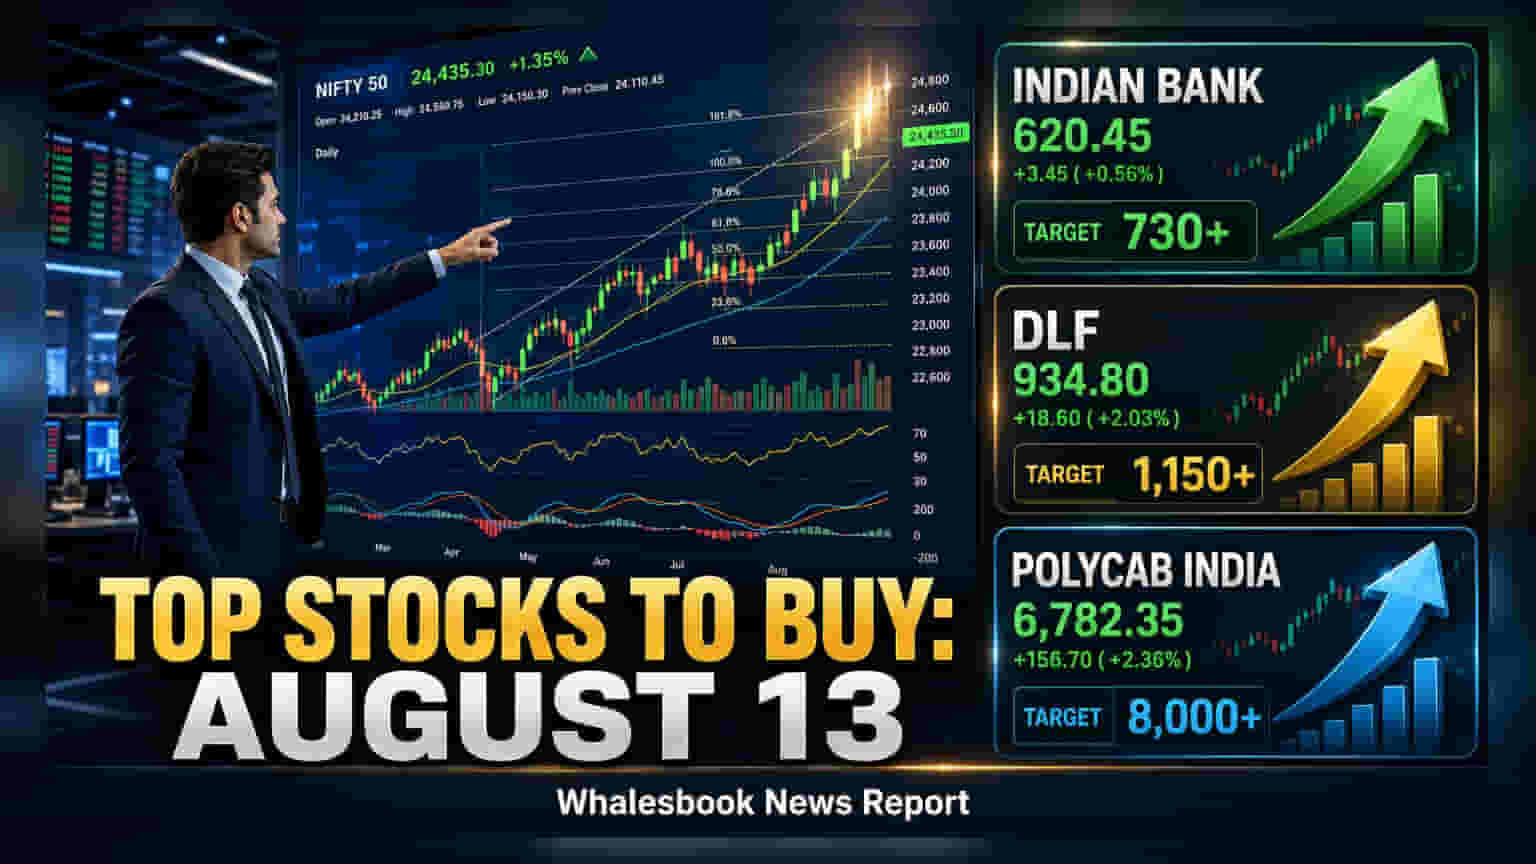
Nuvama Wealth Management analyst Aakash K. Hindocha highlighted Indian Bank, DLF, and Polycab India as technical setups to watch on August 13, 2026. The recommendations rely on specific chart patterns and support levels, occurring as traders evaluate broader index momentum. Investors should remember that technical analysis carries inherent risks and does not account for fundamental company changes or market volatility.
On August 13, 2026, Aakash K. Hindocha, Vice President at Nuvama Professional Clients Group, identified Indian Bank, DLF, and Polycab India as stocks exhibiting potential technical chart patterns. These signals, based on price trends and volume indicators, are intended for short-to-medium-term market participants observing market momentum.
Regarding Indian Bank, the analyst pointed to an inverse head-and-shoulders pattern on the daily chart as a potential indicator of upward momentum. The stock has spent the last three months trading near its 50-week simple moving average, suggesting a consolidation phase. While technical signals suggest a breakout, investors should remember that for public sector banks, financial health remains tied to credit growth, asset quality, and government policy, which are factors beyond chart patterns.
For the real estate developer DLF, the analyst highlighted a pennant pattern, which is a shape that often appears before a continuation of an existing trend. The stock is currently trading near the upper boundary of this formation. However, real estate stocks are highly sensitive to interest rate cycles and demand trends. Investors typically monitor launch timelines and debt management closely, as these fundamental factors can override short-term price movements.
Polycab India was also noted for a potential upward move following a trend line breakout. The stock had undergone a correction since late June, and the current price action is viewed as a retest of former resistance levels. For the cables and wires sector, financial performance is often influenced by infrastructure spending and the volatility of raw material costs, particularly copper prices, which can impact profit margins regardless of technical indicators.
Broader market trends also play a role in how individual stocks perform. On August 12, the Nifty index showed resilience by recovering from intraday losses, with traders watching the 24,575 level as a key point for further upward movement. Meanwhile, the Bank Nifty index has demonstrated strength by trading above its 200-day moving average, signaling potential stability in the banking sector.
Investors evaluating these technical calls should be aware of the inherent risks. Technical analysis is a tool for identifying price patterns, but it cannot predict unexpected market news, regulatory shifts, or macroeconomic shocks. Furthermore, stop-loss levels provided by analysts are intended to limit downside risk, but rapid market volatility can sometimes result in prices moving past these points before a trade can be executed. Because these recommendations rely on past price behavior, they may not account for future fundamental developments.