The Nifty index is testing key support zones between 23,630 and 23,761 amid recent market volatility. HDFC Securities analyst Vinay Rajani has identified potential chart patterns in Gland Pharma and Viyash Scientific. Investors are monitoring these levels to see if the market can hold its ground or if further declines are likely.
What Happened
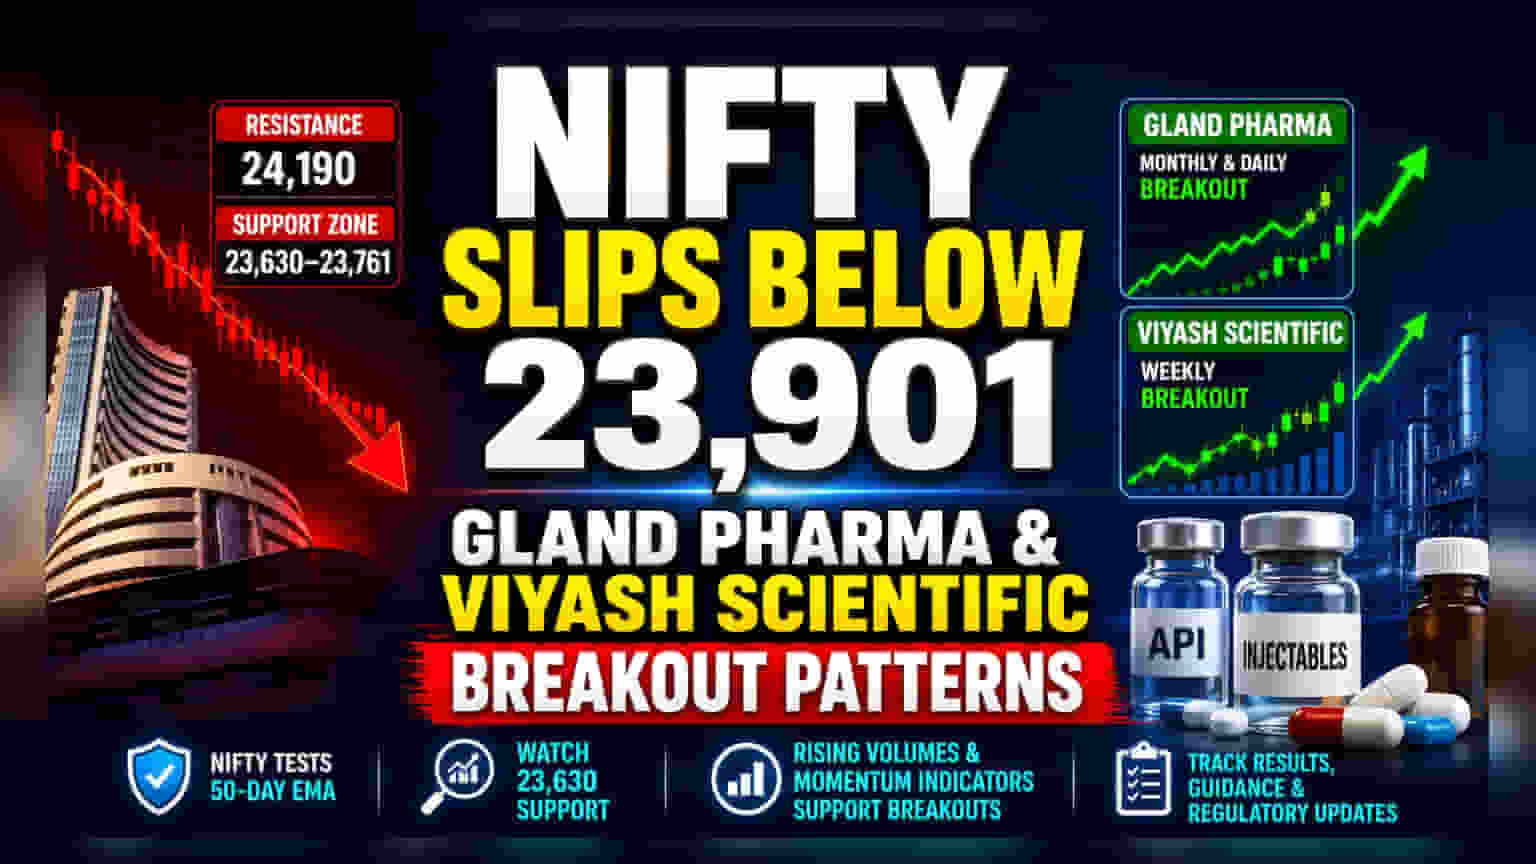
The Nifty index faced renewed selling pressure on Wednesday, failing to break through the 24,190 resistance level and dropping below the 23,901 mark. The index is now testing its 50-day exponential moving average, which is a key technical indicator often used to determine the market's medium-term trend. The benchmark has slipped into a support cluster between 23,630 and 23,761. Analysts note that if the index holds these levels, it could stabilize, but a fall below 23,630 might signal further weakness toward the 23,500 range.
HDFC Securities Technical View
Vinay Rajani, a senior technical analyst at HDFC Securities, has highlighted two companies that have shown interesting chart patterns, which traders often watch to gauge potential price momentum.
For Gland Pharma, the analyst pointed to a breakout on the monthly and daily charts. These patterns are interpreted by technical analysts as signs that the stock may be shifting from a consolidation phase to a potential upward trend.
Similarly, Viyash Scientific was highlighted for a breakout pattern on the weekly chart. The analyst noted that rising trading volumes and momentum indicators—such as the Relative Strength Index and the MACD—are supporting these technical observations. It is important to note that these chart patterns are tools for analyzing past price data and do not guarantee future performance.
Why Investors Should Be Cautious
Technical analysis, while popular, is not a crystal ball. When analysts highlight stocks based on patterns, they are looking at historical price action rather than company fundamentals.
For investors in pharma companies like Gland Pharma, the business reality often includes risks that charts cannot predict. These include regulatory audits by agencies like the USFDA, which can impact manufacturing and exports, as well as pricing pressure in the competitive generic injectable market.
For Viyash Scientific, as a player in the pharmaceutical intermediate and API space, performance is often tied to client demand and global supply chain stability. Changes in raw material costs or shifts in pharmaceutical demand can affect profitability regardless of what the stock chart looks like.
What Investors Should Track Next
Investors will likely watch how the Nifty behaves around the 23,630 support level. A bounce from this level would suggest buyers are entering the market, while a sustained drop below it could lead to increased selling.
Regarding the mentioned stocks, investors typically track whether the price holds above the technical support levels suggested by the analyst. More importantly, shareholders should monitor company-specific news, such as quarterly results, management guidance, and any regulatory updates, which tend to have a more lasting impact on stock prices than short-term chart patterns.