The Nifty 50 index finished the week with a 1.65% gain but formed a 'Doji' candlestick pattern, suggesting uncertainty among investors. While the benchmark index faces resistance near the 24,100 level, market analysts have highlighted specific technical trends in stocks such as Anand Rathi Wealth and Gabriel India.
What Happened
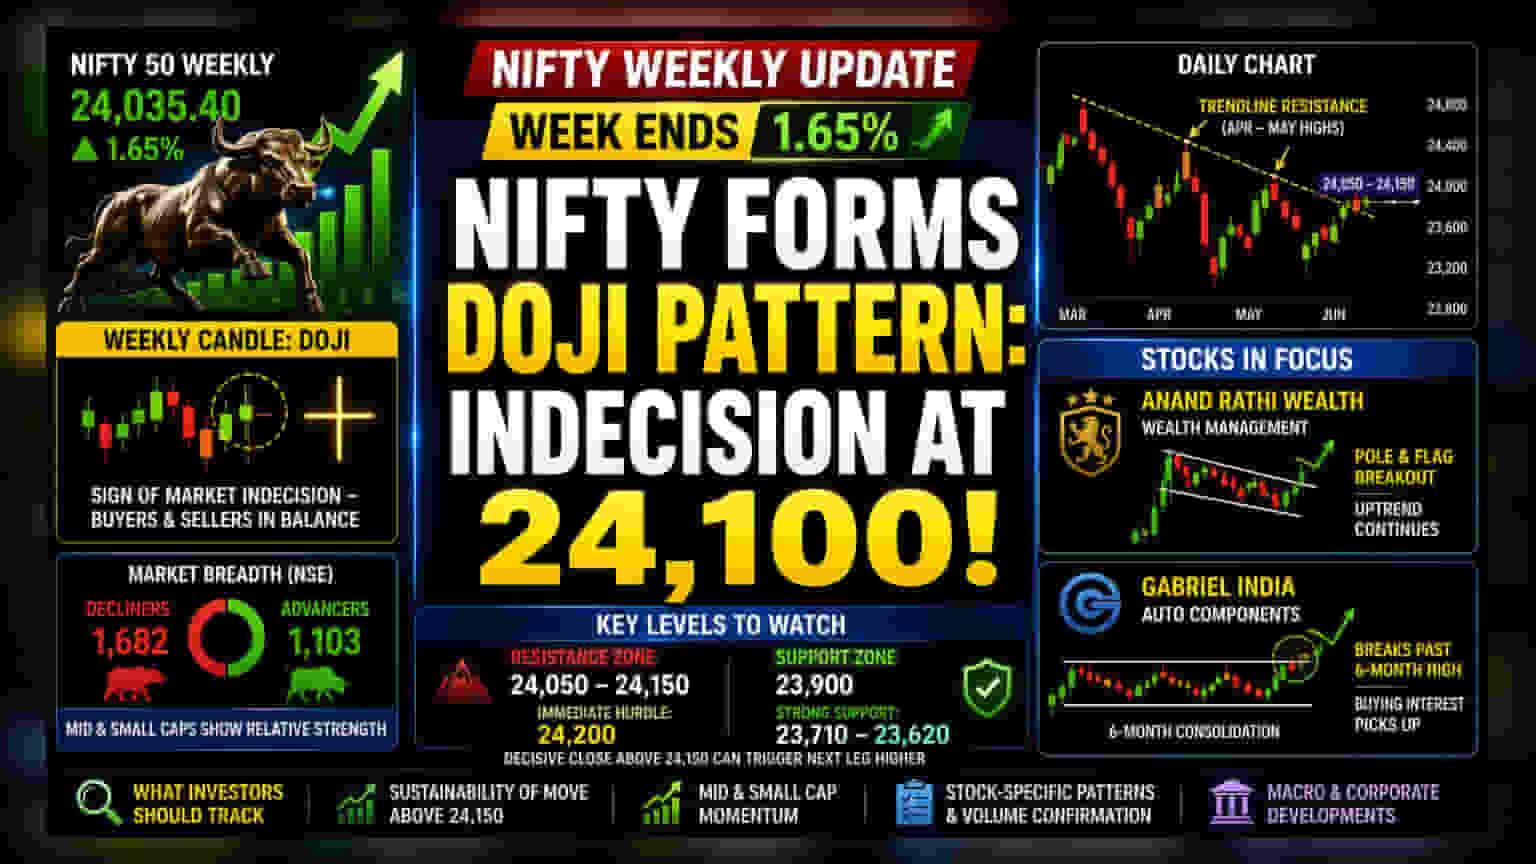
The Nifty 50 index concluded the week with a 1.65% gain, despite experiencing volatility during the final trading session. On the weekly chart, the index formed a 'Doji' pattern. In technical analysis, a Doji occurs when a stock or index's opening and closing prices for a period are nearly the same. This creates a cross-shaped candle, which is often interpreted by traders as a signal of market indecision, where buying and selling pressure appear balanced.
Technical Resistance and Outlook
According to market analysis from Angel One, the Nifty's inability to maintain a closing level above 24,100 has created a zone of uncertainty. Technical indicators suggest that the index is encountering resistance from a downward-sloping trendline that connects price highs observed in April and May. This resistance zone is estimated between 24,050 and 24,150.
For a clearer trend to emerge, analysts suggest looking for a decisive close above 24,150. On the downside, immediate support is placed around 23,900, with a more substantial support area located between 23,710 and 23,620. Traders are currently monitoring whether the index can break past the immediate resistance hurdle near 24,200.
Market Breadth and Sector Strength
While the main benchmark indices remain at critical resistance levels, the broader market—specifically mid-cap and small-cap stocks—has shown relative strength. This divergence often leads investors to focus on stock-specific opportunities rather than the broader index movement, as different sectors may react differently to the current market environment.
Observations on Specific Stocks
Market analysts have recently pointed to specific technical developments in two companies:
Anand Rathi Wealth: This company, which operates in the wealth management sector, has been observed in a primary uptrend. Technical patterns noted by analysts include a 'Pole and Flag' formation, a chart pattern that typically suggests a continuation of the existing trend after a period of consolidation.
Gabriel India: Known for its auto component manufacturing, this stock has reportedly undergone a period of consolidation lasting approximately six months. Recent technical data indicates that the stock has moved above its previous high for that period, which some observers view as a sign of renewed buying interest.
What Investors Should Track Next
Investors are typically focusing on whether the Nifty can sustain levels above the 24,150 mark to signal further strength. Additionally, the performance of mid-cap and small-cap indices remains a key indicator of broader market sentiment. For individual companies like Anand Rathi Wealth and Gabriel India, the main monitorable is whether the identified technical patterns lead to sustained price momentum or if the stocks face renewed resistance at higher levels. Market participants are also keeping an eye on macroeconomic factors and corporate updates that could influence sector-specific performance in the coming weeks.