

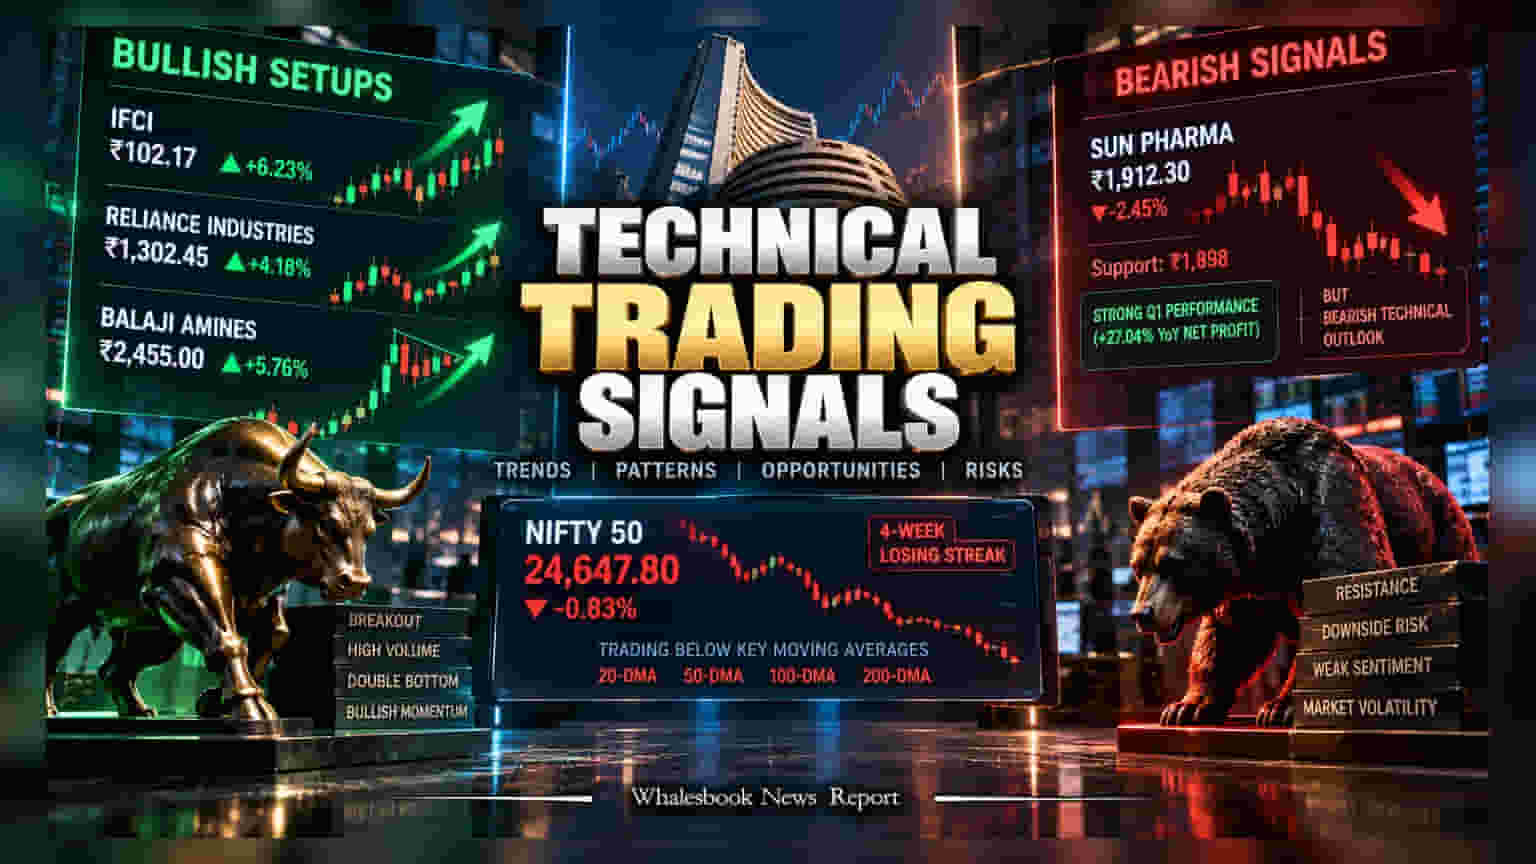
Indian markets are facing a four-week losing streak, with the Nifty 50 trading below key moving averages. While some stocks like IFCI and Reliance Industries show bullish technical setups, analysts warn of bearish momentum for Sun Pharmaceutical Industries despite its strong recent financial growth.
The Indian stock market is entering the trading session with a note of caution as the Nifty 50 index battles a four-week losing streak. Market participants are monitoring the broader trend closely, as the index continues to trade below its 20, 50, 100, and 200-day moving averages. This indicates that the overall market sentiment remains fragile, driven by concerns over geopolitical tensions, elevated crude oil prices, and consistent outflows from foreign investors.
Despite the weak macro environment, technical analysts have identified specific stocks that are showing distinct price patterns. These patterns often help traders gauge where supply and demand are shifting, though they do not guarantee future performance.
Bullish Patterns in Specific Stocks
IFCI has captured attention after breaking through resistance levels. The stock recently traded at Rs 102.17, nearing its 52-week high of Rs 107.50. Analysts are noting that this move is backed by significant volume, which suggests that the recent price increase is supported by genuine market interest rather than minor fluctuations.
Reliance Industries has also emerged as a point of interest, with technical charts showing a completed double-bottom pattern near the Rs 1,250 level. This formation is often viewed by market observers as a potential sign that a stock has found a floor and may attempt to move toward higher targets, with some analysts pointing toward the Rs 1,400 range. Similarly, Balaji Amines has shown a flagged breakout at Rs 2,455, with indicators like the Relative Strength Index suggesting that current upward momentum could be sustainable.
Divergence in Healthcare
Sun Pharmaceutical Industries presents a contrasting case for investors. While the company’s business performance remains robust—evidenced by a 27.04% year-on-year rise in net profit for the first quarter of fiscal year 2027—the technical picture is currently signaling caution.
Analysts have flagged a bearish trend for the stock, noting that it faces potential downside risks if it fails to hold its immediate support level of Rs 1,898. This creates an interesting divergence where the company's financial strength is being challenged by negative chart formations. Investors often monitor such situations closely, as strong earnings can sometimes be overshadowed by short-term selling pressure driven by technical setups.
What Investors Should Monitor
Given the current market volatility, the primary challenge for investors is distinguishing between short-term chart signals and long-term business performance. While technical setups like the ones in IFCI or Reliance Industries can signal interest, they are heavily influenced by the broader market trend. With the Nifty 50 struggling to reclaim its key moving averages, any potential breakout could face hurdles if the overall market sentiment remains bearish.
Looking ahead, market participants will be watching whether these stocks can sustain their momentum despite the wider index weakness. For companies like Sun Pharmaceutical Industries, upcoming investor meetings scheduled for mid-September will be important to watch, as management commentary often carries more weight than technical patterns alone.