

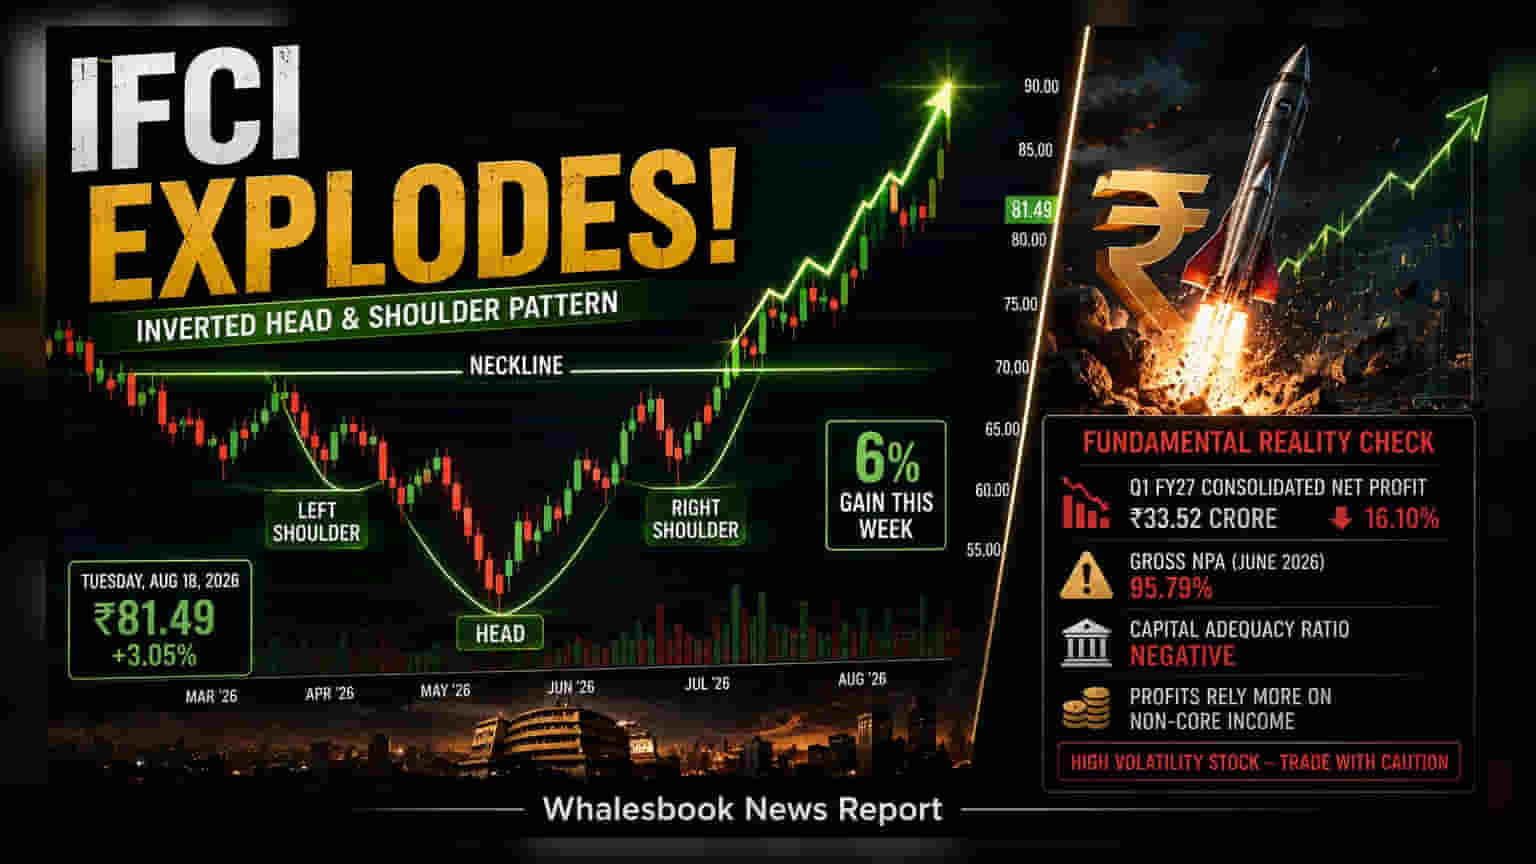
IFCI stock climbed about 6% this week, driven by technical chart patterns. While traders are watching these signals, the company's recent Q1 FY27 results showed a 16% drop in profit and ongoing challenges in its core lending business. There is currently no major business news supporting this price move.
IFCI shares have seen a 6% increase this week, drawing attention from market participants tracking price trends. On Tuesday, August 18, 2026, the stock reached ₹81.49, marking a gain of over 3% for the day. This price movement has led technical analysts to point out the formation of an "inverted head and shoulder" pattern on the stock charts.
Understanding the Technical Signal
In simple terms, an inverted head and shoulder pattern is a chart formation that some traders follow to identify a potential change in a stock’s trend. It typically appears after a long period of decline and is interpreted by some analysts as a signal that the stock may have finished its downward slide and could potentially see upward movement. However, it is important to understand that such patterns reflect past price behavior and market sentiment, not necessarily the actual financial health or business performance of the company.
Fundamental Reality Check
While the stock price has reacted to these technical signals, the company's recent financial performance presents a different picture. IFCI released its results for the first quarter of the 2027 financial year on August 11, 2026, which showed that its consolidated net profit declined by 16.10% to ₹33.52 crore.
The company’s core business—lending—continues to face significant pressure. Financial data from June 2026 indicates that the company holds a high Gross Non-Performing Asset (GNPA) ratio of 95.79%. Additionally, the company reported a negative Capital Adequacy Ratio, a metric that indicates whether an institution has enough capital to handle its risks. These metrics suggest that the company’s ability to lend and its overall financial strength remain under strain.
Investor Perspective
Investors monitoring the stock should distinguish between technical price trends and business fundamentals. Currently, there is no official corporate announcement or material development to support this stock price rise from a fundamental perspective. The company’s profits have recently relied more on non-core income rather than its main lending operations.
Furthermore, the stock is known for high volatility, meaning it can experience sharp price swings more frequently than many other Indian stocks. Because the current price movement is primarily driven by chart patterns rather than business growth, investors should be cautious. The key monitorable for the coming weeks will be whether the stock price can sustain these levels or if the weak financial performance begins to weigh on market sentiment again.