

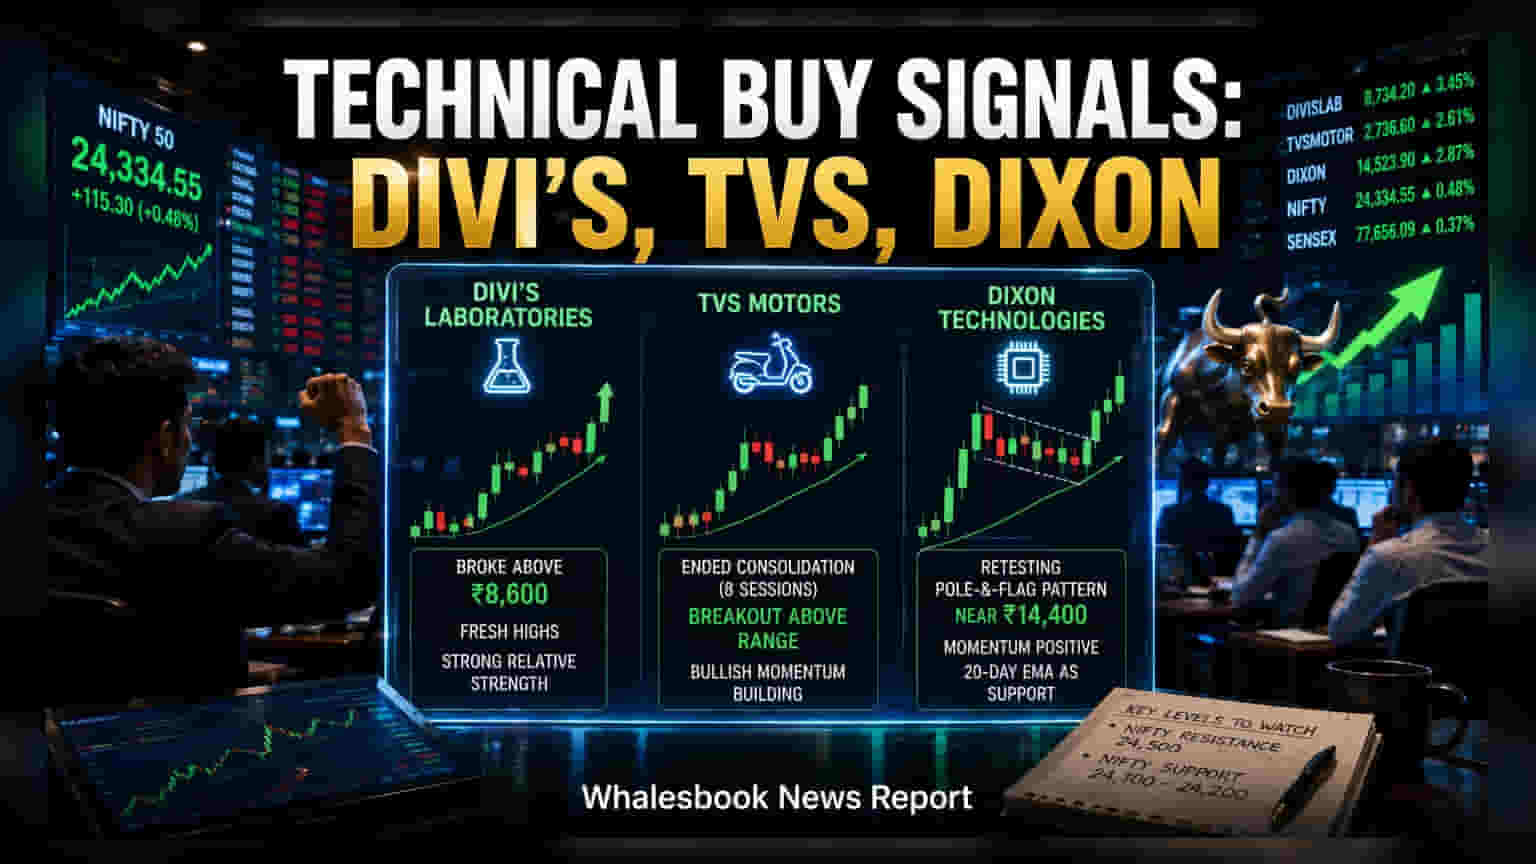
Market analyst Chandan Taparia has highlighted positive technical chart patterns for Divi’s Laboratories, TVS Motors, and Dixon Technologies on August 26, 2026. These stocks are showing strong momentum as the Nifty index attempts to stabilize above the 24,250 mark, though investors should balance these signals with broader market volatility.
Market analyst Chandan Taparia, representing Motilal Oswal Financial Services, has identified distinct bullish patterns for Divi’s Laboratories, TVS Motors, and Dixon Technologies on August 26, 2026. These observations come as the Nifty index navigates key resistance levels, having successfully crossed the 24,250 threshold after overcoming early session volatility.
Divi’s Laboratories has attracted attention after moving past the 8,600 zone to hit fresh highs. Technical analysis suggests the company is displaying strong relative strength, which means it is performing better than the broader market average. In the pharmaceutical sector, investors often track such momentum as a sign of institutional interest, though sustainability depends on ongoing sector demand and stable pricing environments.
TVS Motors has also entered the spotlight after ending a period of narrow trading, often called consolidation, which lasted for about eight sessions. In technical terms, this move is viewed as a sign that the stock may be gathering fresh energy for a potential trend. The auto sector, which TVS operates in, has remained a focus for investors due to volume trends and competitive dynamics. Traders often watch for sustained moves above recent highs as a confirmation of such patterns.
Dixon Technologies is currently being noted for a retest of a specific chart formation known as a pole-and-flag pattern near the 14,400 level. This pattern is typically monitored by traders to gauge whether a stock can continue its previous upward trend. As a major player in the electronics manufacturing services (EMS) sector, Dixon’s price action is frequently linked to expectations of capacity expansion and manufacturing demand. The current technical outlook remains focused on momentum indicators staying positive, with the 20-day average serving as a potential support floor.
While these technical signals highlight short-term momentum, it is important for investors to remember that technical patterns are only one aspect of stock analysis. These indicators do not account for external events like changes in company fundamentals, management updates, or sudden shifts in the global economic landscape. Market volatility can often override technical setups, leading to rapid price changes. Investors might find it useful to verify these technical views against the company’s recent quarterly earnings, debt levels, and long-term business performance to get a complete picture before making any investment decisions.