Market analysts are highlighting potential technical breakouts in nine Indian stocks, including Allied Blenders and Aegis Logistics. These reports analyze price patterns and trading volumes to identify short-term momentum. Investors should understand that these are technical observations based on past price action and market trends, which do not guarantee future performance.
What Happened
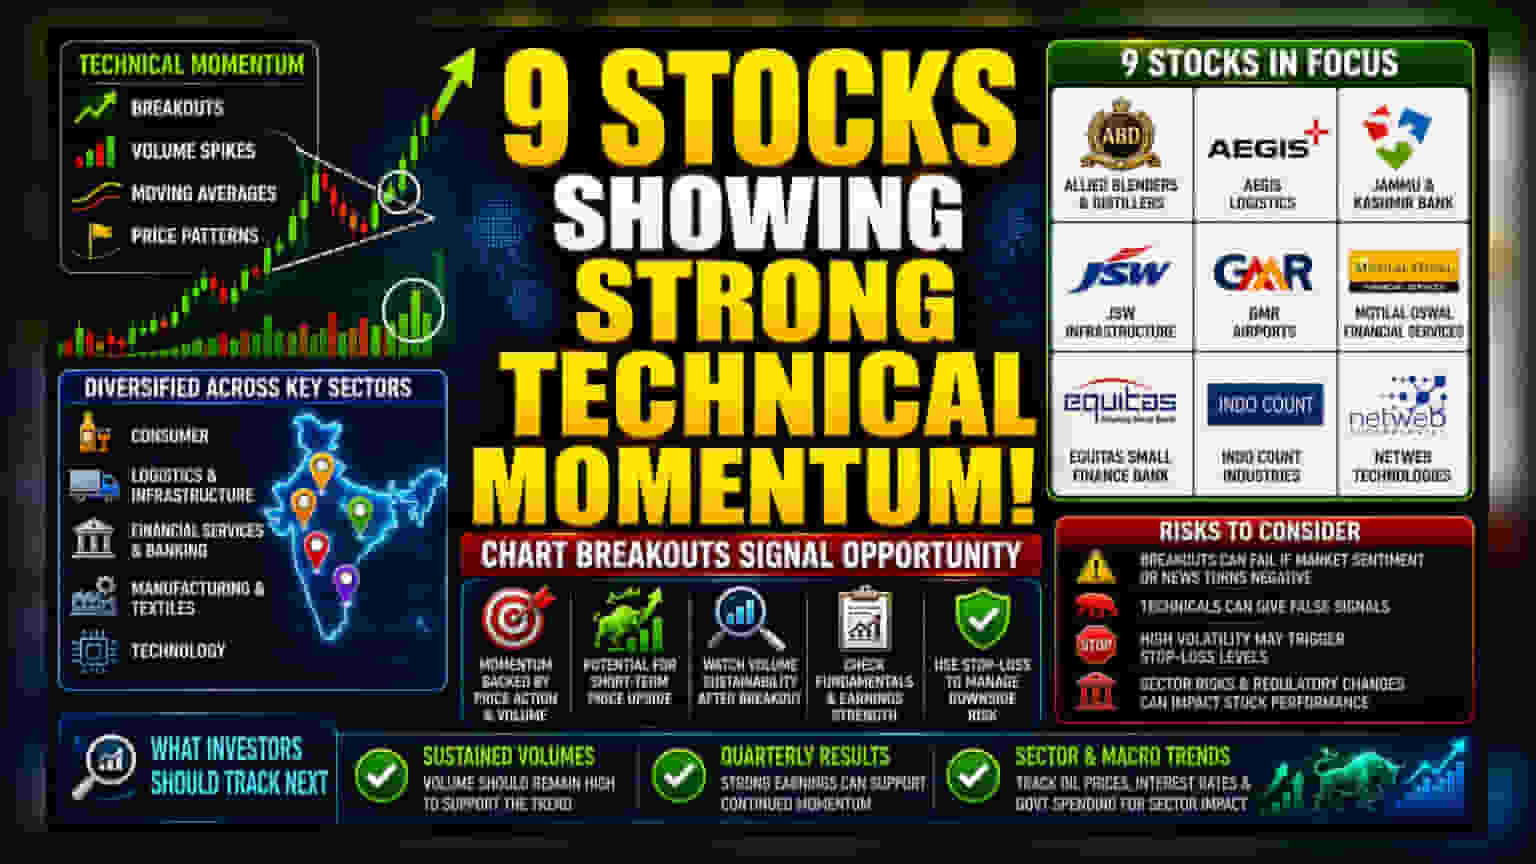
Financial analysts and brokerage firms have recently highlighted a group of nine Indian companies based on their technical chart patterns. These reports suggest that Allied Blenders and Distillers, Aegis Logistics, Jammu and Kashmir Bank, JSW Infrastructure, GMR Airports, Motilal Oswal Financial Services, Equitas Small Finance Bank, Indo Count Industries, and Netweb Technologies are showing potential for price momentum. The analysts base these views on indicators such as price breakout patterns, volume spikes, and moving averages, which are mathematical tools used to study past price history.
Understanding Technical Momentum
Technical analysis focuses on how a stock’s price has moved in the past rather than the company’s underlying business value or financial health. Analysts look for specific shapes and trends on charts. For example, some analysts noted "flag" patterns or "rectangle bases," which they interpret as signs of accumulation, meaning more buyers may be entering the stock. When a stock breaks through a previous high price (a breakout) on high trading volumes, analysts often view this as a sign that the trend has gained strength. This is common in short-term trading strategies aimed at capturing price movements.
Diversity of the Identified Stocks
The nine companies mentioned cover a wide range of sectors in the Indian economy, which reflects the breadth of market interest. For instance, Allied Blenders operates in the spirits and beverage industry, while JSW Infrastructure and GMR Airports represent the infrastructure and logistics space. The financial sector is represented by Jammu and Kashmir Bank, Motilal Oswal Financial Services, and Equitas Small Finance Bank. Indo Count Industries represents the manufacturing and home textiles export sector, and Netweb Technologies is involved in the technology hardware space. This variety suggests that technical momentum is currently being spotted across different segments of the market rather than being limited to just one industry.
How Investors May Read This
It is important for investors to distinguish between a technical trading idea and a long-term investment. Technical calls are often aimed at short-term price movements and rely heavily on market sentiment and liquidity. A breakout pattern is a signal of what has happened, not a prediction of what will definitely happen. An investor looking at these reports should check if the company’s actual business performance—such as revenue growth, profit margins, and debt levels—supports the optimistic price trend. A stock might look good on a chart, but the long-term health of the investment still depends on the company's ability to generate cash and grow its business.
Risks to Consider
Reliance on technical patterns carries specific risks. Market conditions can change rapidly, and a technical breakout can fail if the broader market sentiment shifts or if unexpected news affects a specific sector. Technical indicators can also provide false signals. Furthermore, these recommendations often come with stop-loss levels, which are predefined price points used to limit losses if the trade does not go as expected. Investors should be aware that high volatility in the market can trigger these levels, leading to losses. Additionally, sector-specific risks, such as regulatory changes in banking or raw material cost pressures in textiles, can easily override any positive chart patterns.
What to Monitor Next
Investors tracking these stocks may look for a few key developments. First, check if the high trading volumes mentioned in the reports are sustained; if volume dries up after a breakout, the move may not last. Second, monitor the upcoming quarterly results for each company, as strong earnings often provide the fundamental backing that helps a price trend continue. Finally, watch for broader sector trends. For example, trends in global oil prices, interest rates, or government infrastructure spending will likely influence companies in the logistics and banking sectors, regardless of what their price charts currently suggest.