

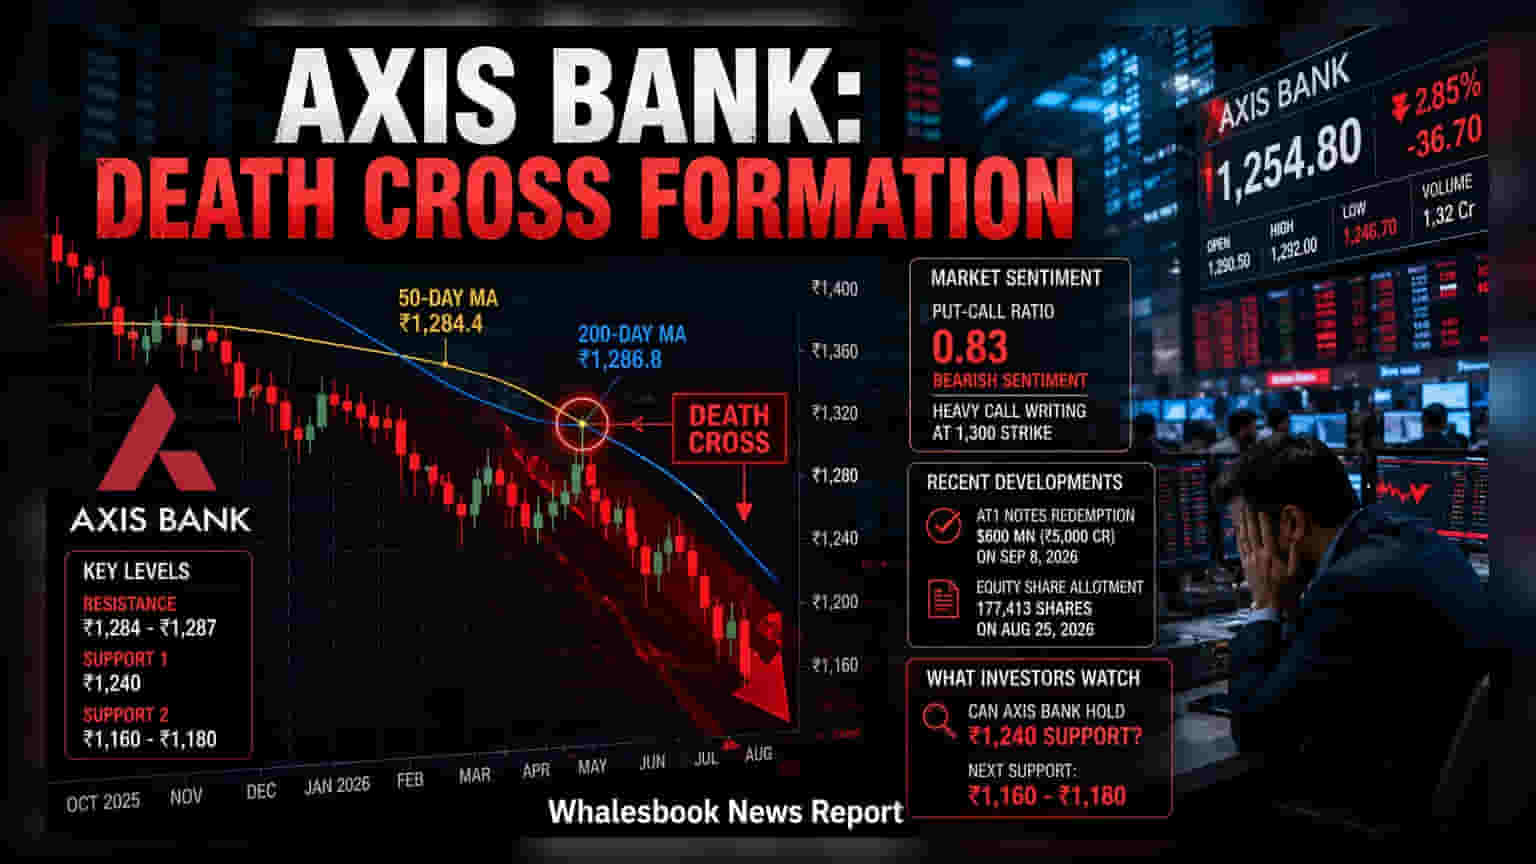
Axis Bank has triggered a 'Death Cross' on its daily chart, a technical pattern where the 50-day moving average drops below the 200-day average. While traders often view this as a sign of potential near-term price pressure, the bank continues its regular financial operations, including a upcoming $600 million bond redemption scheduled for September.
Axis Bank is currently under scrutiny from technical analysts after forming a 'Death Cross' on its daily chart. This pattern occurs when a stock's 50-day moving average, a measure of recent price trends, crosses below its 200-day moving average, which tracks long-term trends. On the charts, the 50-day average has dipped to approximately ₹1,284.4, slightly below the 200-day average of ₹1,286.8. For market traders, this cross is often interpreted as a signal that the stock may face continued downward pressure in the near term.
This is the first time Axis Bank has seen this specific technical formation since October 2025. Following this development, the stock is encountering resistance in the ₹1,284 to ₹1,287 zone, where the moving averages have converged. Analysts monitoring these levels suggest that any attempt at a price recovery will likely meet selling pressure around this range. On the downside, the 20-day moving average is providing an immediate, though fragile, support level near ₹1,240. Should the stock break below this, traders often look toward further support zones near ₹1,160 to ₹1,180.
While the chart patterns signal caution, the bank's operational and financial activities remain in focus. Axis Bank recently confirmed plans to fully redeem its $600 million (approximately ₹5,000 crore) Additional Tier 1 (AT1) notes on September 8, 2026, after receiving regulatory approval. This redemption is a financial event that reflects the bank’s liquidity position and its ability to manage its capital structure effectively, independent of daily stock price fluctuations. Additionally, the bank completed an allotment of 177,413 equity shares on August 25, 2026, as part of its employee stock option schemes.
Derivative market data further mirrors the current bearish sentiment. The Put-Call Ratio, a metric used to gauge market mood, sits at 0.83, suggesting that traders are more cautious about upside potential. Heavy call writing at the 1,300 strike price indicates that many market participants believe the stock will struggle to breach that level in the immediate future.
For investors, the immediate monitorable will be the stock's ability to hold the ₹1,240 support level. While chart indicators provide a snapshot of current market sentiment, long-term investors typically weigh these against broader financial performance, such as asset quality, loan growth, and credit costs in upcoming quarterly results. The contrast between the current technical bearishness and the bank's active capital management remains the key dynamic for market participants to track.