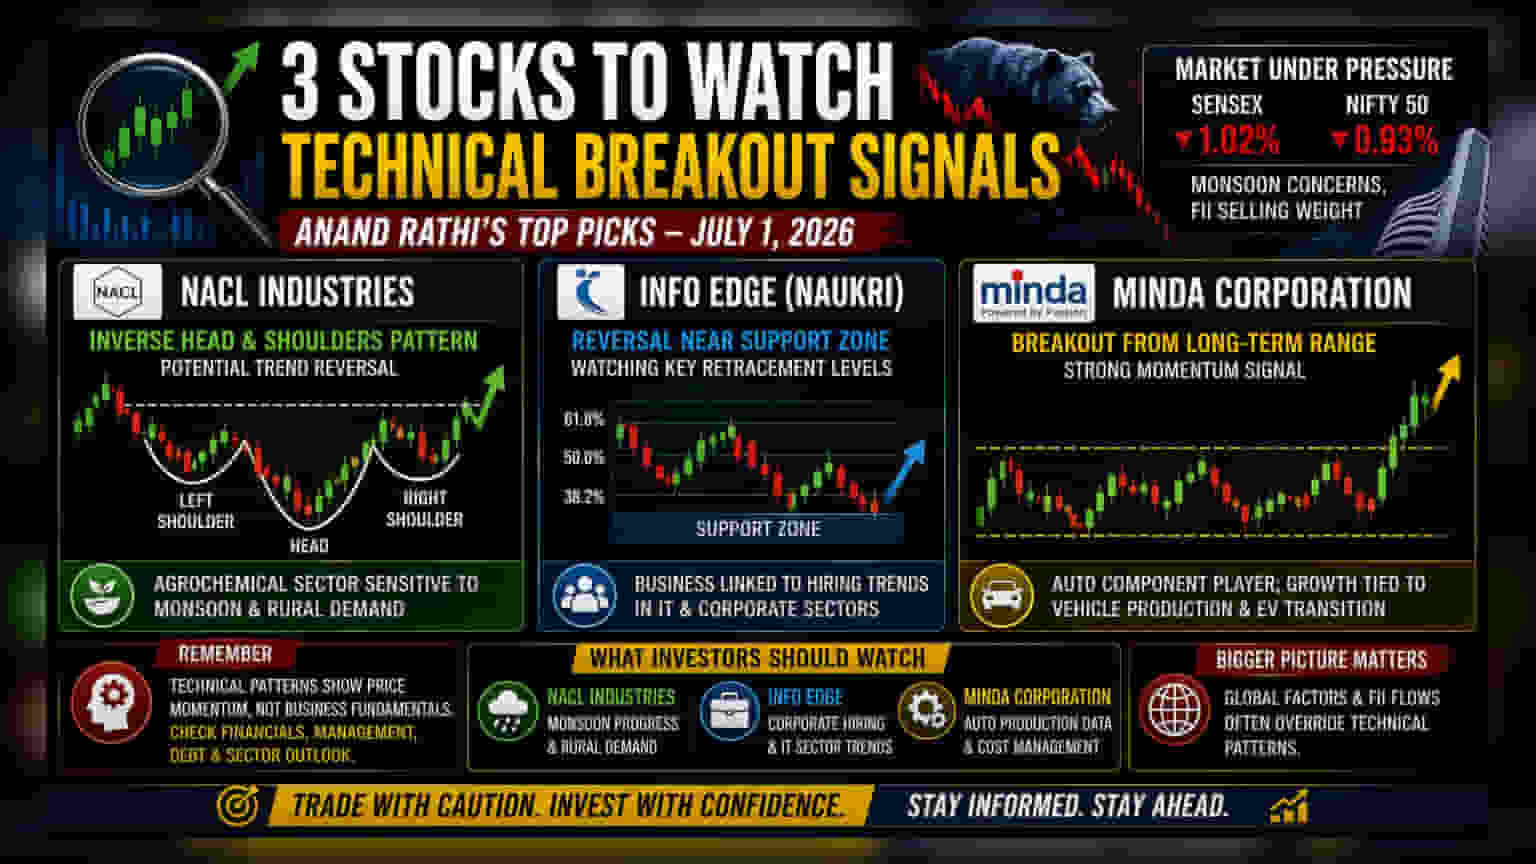
Brokerage Anand Rathi has noted specific chart patterns for NACL Industries, Info Edge, and Minda Corporation in its July 1, 2026 report. The analysis highlights breakout signs and potential support levels for these equities amid recent market volatility. Investors often view these technical signals as indicators of momentum, though fundamental business data remains essential for long-term decisions.
What The Technical Report Says
Brokerage firm Anand Rathi released a research update on July 1, 2026, pointing to three companies showing notable chart movements. Analysts from the firm highlighted that NACL Industries, Info Edge (Naukri), and Minda Corporation are displaying specific patterns on their daily price charts. This comes at a time when the broader Indian equity market, represented by the BSE Sensex and Nifty 50, has experienced recent downward pressure, with investors weighing concerns over monsoon progress and selling by foreign institutional investors.
NACL Industries And Sector Sensitivity
For NACL Industries, the brokerage pointed to an 'Inverse Head and Shoulders' pattern. In technical analysis, this shape is often interpreted as a sign that a stock may be shifting from a declining trend to a potential upward one after a period of stability. NACL Industries operates in the agrochemical sector. While technical charts suggest momentum, investors should note that the company’s performance is historically linked to monsoon patterns and the demand for farm chemicals. Any change in seasonal rainfall can directly impact the business, regardless of what the share price chart indicates.
Info Edge And The Market Rebound Question
Info Edge, the parent company of the job portal Naukri, is currently being watched for a potential reversal near a support zone—a price level where historical selling has slowed down in the past. Analysts noted that the stock has moved toward levels that align with common mathematical retracement points often used by traders to spot bottoming out. However, the business reality for Info Edge is tied closely to the broader job market and tech hiring trends. If corporate hiring slows down, it can impact the company’s core recruitment business, even if technical charts suggest a price rebound.
Minda Corporation And The Auto Sector Context
Minda Corporation has been identified for breaking out of a long-term price range that has lasted for several months. A breakout, in technical terms, suggests that the stock price has moved above a previous ceiling, indicating increased buying interest. Minda Corporation is a key player in the auto component sector, producing wiring harnesses and other systems. As with any auto ancillary firm, its growth is closely tied to vehicle production volumes and the transition toward electric vehicles. Investors should track whether the company can maintain volume growth in a competitive auto parts market.
The Reality Of Technical Analysis
It is important for investors to remember that technical analysis, such as chart patterns and support levels, focuses on past price movements and trader psychology. These tools can help identify momentum in the short term, but they do not predict the future performance of the underlying business. Factors like quarterly profit margins, debt levels, management quality, and sector-wide regulatory changes are equally important for a complete investment thesis. Reliance solely on technical signals without checking the financial health of the company carries risks, especially during periods of high market volatility.
What Investors Should Watch Next
For those monitoring these companies, the next steps involve looking beyond the charts. For NACL Industries, monitor reports on monsoon progress and rural demand. For Info Edge, watch for updates on hiring activity across the IT and corporate sectors. For Minda Corporation, track the latest auto production data and the company's ability to manage costs in the auto components industry. Finally, all investors should keep an eye on broader market sentiment, as global factors and foreign institutional investment trends often override individual stock technical patterns.