

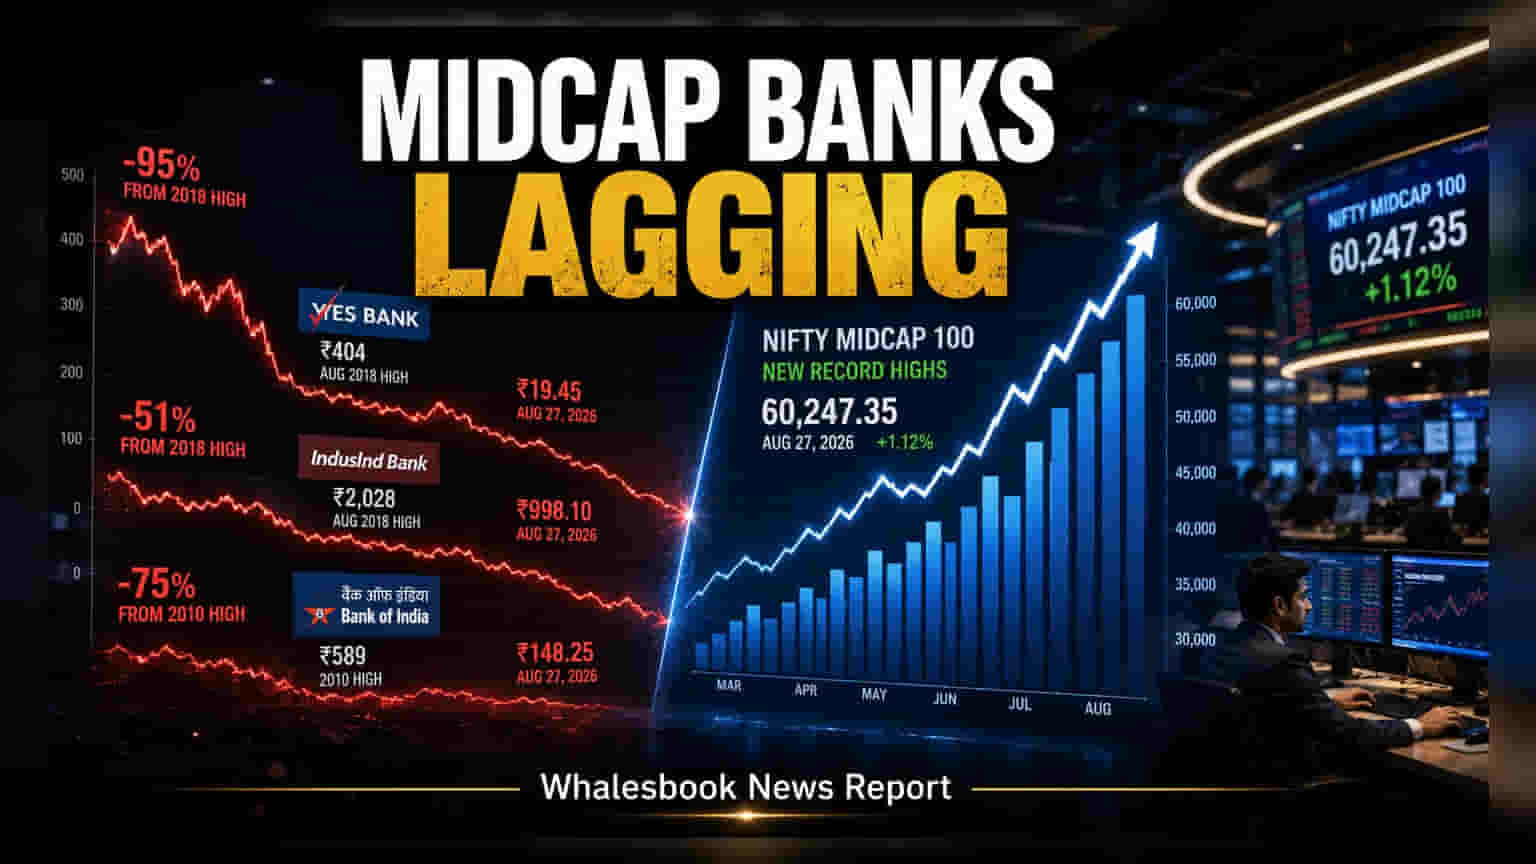
While the Nifty Midcap 100 index has been hitting new record highs in August 2026, specific banking stocks including Yes Bank, IndusInd Bank, and Bank of India remain trading significantly below their historical peaks. This divergence between the broader market rally and these individual lenders highlights a gap where share prices have not kept pace with the overall index momentum.
The Indian equity market is currently displaying a sharp divide. As of August 27, 2026, the Nifty Midcap 100 index has been on a strong run, frequently setting new record highs throughout the month. However, a group of midcap banking stocks has failed to participate in this rally, leaving them trading at a fraction of their historical all-time highs. This performance gap suggests that while the broader market has strong momentum, specific banking names are facing individual hurdles that are holding back their share prices.
Yes Bank is one such example, trading nearly 95% below its August 2018 peak of ₹404. Despite the sharp decline in its share price over the years, the bank has shown some fundamental improvement in its recent business performance. For the first quarter of the 2027 financial year, the bank reported a standalone net profit of ₹1,071 crore, which is a 34% increase compared to the same period last year. It has also managed its asset quality, reporting a net NPA (bad loans) of 0.2%. For investors, this creates a contrast between the bank's improved profit profile and the lack of stock price recovery.
IndusInd Bank, which holds a market capitalization of roughly ₹78,078 crore, is also trailing behind, trading about 51% below its August 2018 high of ₹2,028. The stock has struggled to build momentum, often testing support zones rather than breaking out toward new highs. Market observers note that its performance is currently subdued, with the stock trading near critical moving averages, which often act as a line in the sand for traders deciding whether to buy or sell.
Bank of India presents a different picture, though it remains about 75% below its 2010 record high of ₹589. From a technical perspective, the stock has shown a more steady pattern compared to its peers, forming a symmetrical triangle on the charts while staying above its long-term average price levels. This structure suggests that while it is not rallying with the broader market, it is avoiding the persistent downward pressure seen in other laggards.
For investors, the key challenge is understanding why these stocks are not following the Nifty Midcap 100 higher. The divergence often stems from a mix of historical valuation erosion, specific asset quality concerns, and shifting investor sentiment toward other sectors. The market appears to be favouring high-growth areas over these traditional midcap lenders. The important monitorables for shareholders moving forward will be whether these banks can continue to show consistent growth in their quarterly profits and whether that eventually leads to a change in market sentiment and better share price performance.