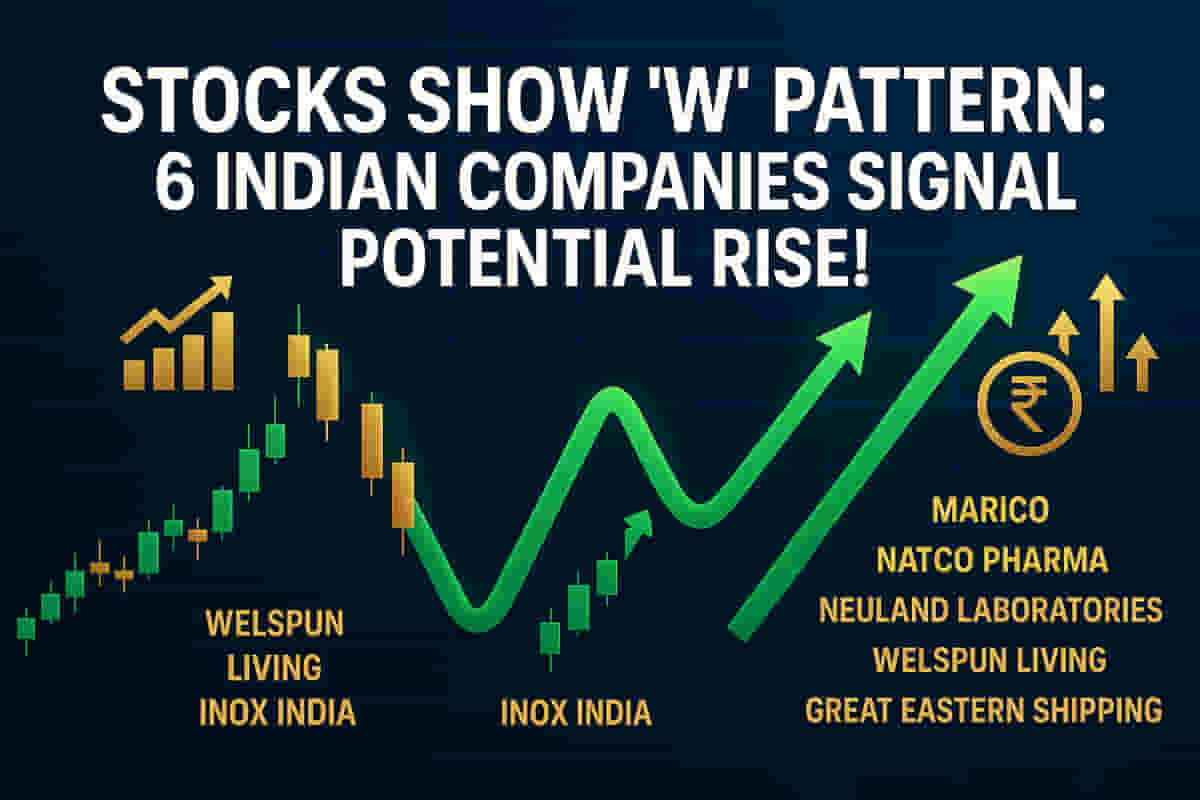
Technical Charts Signal Potential Rebound in Six Indian Stocks
Technical analysis of the Indian stock market has identified a significant bullish pattern, known as the 'Double Bottom', in six midcap and smallcap stocks. This pattern, often likened to the letter 'W' on price charts, typically signals a potential reversal from a downtrend to an uptrend, suggesting that these stocks could be poised for price appreciation.
The Core Issue: The Double Bottom Pattern
The 'Double Bottom' pattern is a widely recognized bullish reversal indicator in technical analysis. It forms when a stock price declines to a support level, rebounds, falls back to the same or a very similar support level, and then rallies significantly. The formation of two distinct troughs at similar price points, separated by a moderate peak, indicates strong buying interest emerging at lower levels, overwhelming selling pressure.
Identified Stocks Poised for Potential Upswing
Analysis of the Nifty MidCap 150 and Nifty SmallCap 250 indices highlighted six specific stocks where this pattern has recently materialized. Among midcap stocks, Marico, currently priced at ₹735, formed a 'Double Bottom' around the ₹707 level on November 7, 2025, and December 4, 2025. In the smallcap segment, five stocks have also exhibited this pattern.
Natco Pharma, with a current market price of ₹910, shows its 'Double Bottom' around ₹865, observed on November 28, 2025, and December 10, 2025. Neuland Laboratories, trading at ₹16,263, has its 'Double Bottom' near ₹15,850 formed on December 2, 2025, and December 8, 2025. Welspun Living, at a current price of ₹136, formed its pattern around ₹128 on November 25, 2025, and December 8, 2025. Inox India, currently priced at ₹1,139, displays its 'Double Bottom' around ₹1,108, noted on November 19, 2025, and December 9, 2025. Lastly, Great Eastern Shipping Company, with a current market price of ₹1,117, has a 'Double Bottom' around ₹1,057 formed on November 25, 2025, and December 9, 2025.
Financial Implications and Market Reaction
For investors, the formation of a 'Double Bottom' suggests that the selling pressure might be exhausted, and a new upward trajectory could begin. Traders often look to enter positions as the price breaks above the pattern's resistance level (the peak between the two troughs) or as it shows strong upward momentum following the second bottom. This can lead to increased trading volumes and investor interest in these specific stocks.
Future Outlook and Potential
While technical patterns do not guarantee future performance, they offer insights into market sentiment and potential price movements. The 'Double Bottom' pattern suggests that these six stocks might be at an inflection point. Investors are advised to conduct their own due diligence, considering fundamental factors alongside technical indicators, before making any investment decisions.
Impact
This news directly impacts investors and traders who follow technical analysis strategies. The identification of a bullish reversal pattern in these specific stocks could lead to increased attention, potential buying activity, and price movements, affecting their market performance. For the broader market, while these are individual stock movements, a series of such patterns across different segments can contribute to overall market sentiment. The market impact rating for this news is 6 out of 10, as it provides actionable insights for a segment of investors but does not represent a systemic market event.
Difficult Terms Explained
- Double Bottom: A bullish technical chart pattern that resembles the letter 'W', indicating a potential reversal of a downtrend.
- Bullish Reversal Pattern: A chart pattern that suggests a security's price is likely to shift from a downward trend to an upward trend.
- Technical Analysis: A trading discipline employed to evaluate investments and identify trading opportunities by analyzing statistical trends gathered from trading activity, such as price movement and volume.
- Midcap: Companies with a medium market capitalization, typically falling between small-cap and large-cap companies.
- Smallcap: Companies with a small market capitalization, generally considered to have higher growth potential but also higher risk.
- Nifty MidCap 150 / Nifty SmallCap 250: Stock market indices that track the performance of midcap and smallcap companies listed on the National Stock Exchange of India.