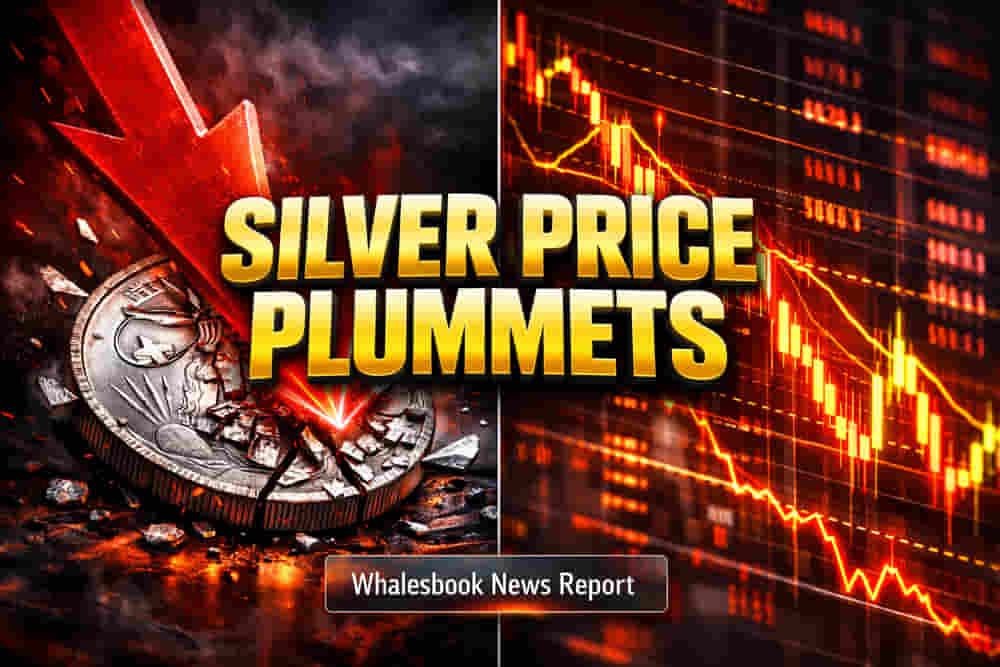
Silver's Dramatic Plunge After Record High
Silver prices experienced a breathtaking fall on Monday, losing Rs 21,000 per kilogram in a single hour on the MCX. This dramatic correction came shortly after the white metal had touched an unprecedented life-time high of Rs 2,54,174 per kg earlier in the trading session. The intraday low recorded was Rs 2,33,120 per kg as investors moved swiftly to secure their gains.
Globally, silver mirrored this volatility. It briefly surged past the significant $80 per ounce mark for the first time before reversing course and trading below this threshold. This sharp move highlights the intense speculative interest and rapid price shifts currently characterizing the silver market.
Factors Driving the Pullback
The sudden downturn in silver prices is a result of several converging factors. Primarily, aggressive profit-taking by investors who had benefited from silver's remarkable rally played a crucial role. Since the start of the year, silver had already surged by an impressive 181%, significantly outperforming gold.
Reports indicating progress in discussions between United States President Donald Trump and Ukrainian President Volodymyr Zelensky regarding a potential peace agreement also dented the demand for silver as a safe-haven asset. Easing geopolitical tensions typically reduce the appeal of traditional safe havens like precious metals.
Exchange Actions and Expert Views
Adding to the downward pressure was an announcement from the Chicago Mercantile Exchange (CME), which operates major derivatives platforms. The CME increased the initial margin requirement for its March 2026 silver futures contract to approximately $25,000, up from $20,000 earlier in the month. Such margin hikes make trading futures contracts more expensive, potentially leading to reduced leverage and forced liquidations.
Jigar Trivedi, a senior research analyst at Reliance Securities, noted that while the broader outlook for silver remains constructive, investors should anticipate sharp swings. He identified the Rs 2.4 lakh level as a key near-term support area.
Financial services firm BTIG cautioned that silver's rally had become "parabolic," a price pattern often followed by a swift and severe reversal rather than a gradual correction. Technical analysis shows silver trading significantly above its 200-day moving average, a level historically preceding substantial price drops after similar rallies.
Manish Banthia, chief investment officer for fixed income at ICICI Prudential Mutual Fund, echoed these concerns, referencing historical precedents like the 1979-80 and 2011 price booms, both followed by over 75% corrections. The current rally, which has seen prices increase more than six times since pandemic lows, suggests that much of the positive narrative may already be priced in, potentially setting the stage for further downside.
Impact
This sharp volatility in silver prices directly impacts commodity traders and investors holding silver or related financial instruments. It signals a potential shift in market sentiment and could influence movements in other precious metals and broader financial markets. The rapid price swings also highlight the risks associated with highly speculative rallies. The impact rating for the Indian stock market is 7 out of 10 due to significant retail investor interest in commodities like silver.
Difficult Terms Explained
- MCX Silver March futures: A contract to buy or sell a specific amount of silver at a predetermined price on a future date (March) on the Multi Commodity Exchange.
- Profit taking: Selling an asset after its price has risen significantly to secure the earned profit.
- Geopolitical risks: Potential dangers arising from international relations, conflicts, and political instability between countries.
- Safe haven demand: Investor behavior of buying assets perceived as safe during times of economic or political uncertainty.
- Margin requirement: The amount of money an investor must deposit with a broker to cover potential losses on a futures contract.
- Parabolic rally: A rapid, exponential increase in an asset's price that forms a steep, upward-curving arc on a price chart.
- 200-day moving average: A technical indicator used by traders to assess the long-term trend of an asset, calculated by averaging its closing prices over the past 200 trading days.
- Derivatives: Financial contracts whose value is derived from an underlying asset, such as futures contracts.