Tenneco Clean Air India Reports Strong FY26 Performance
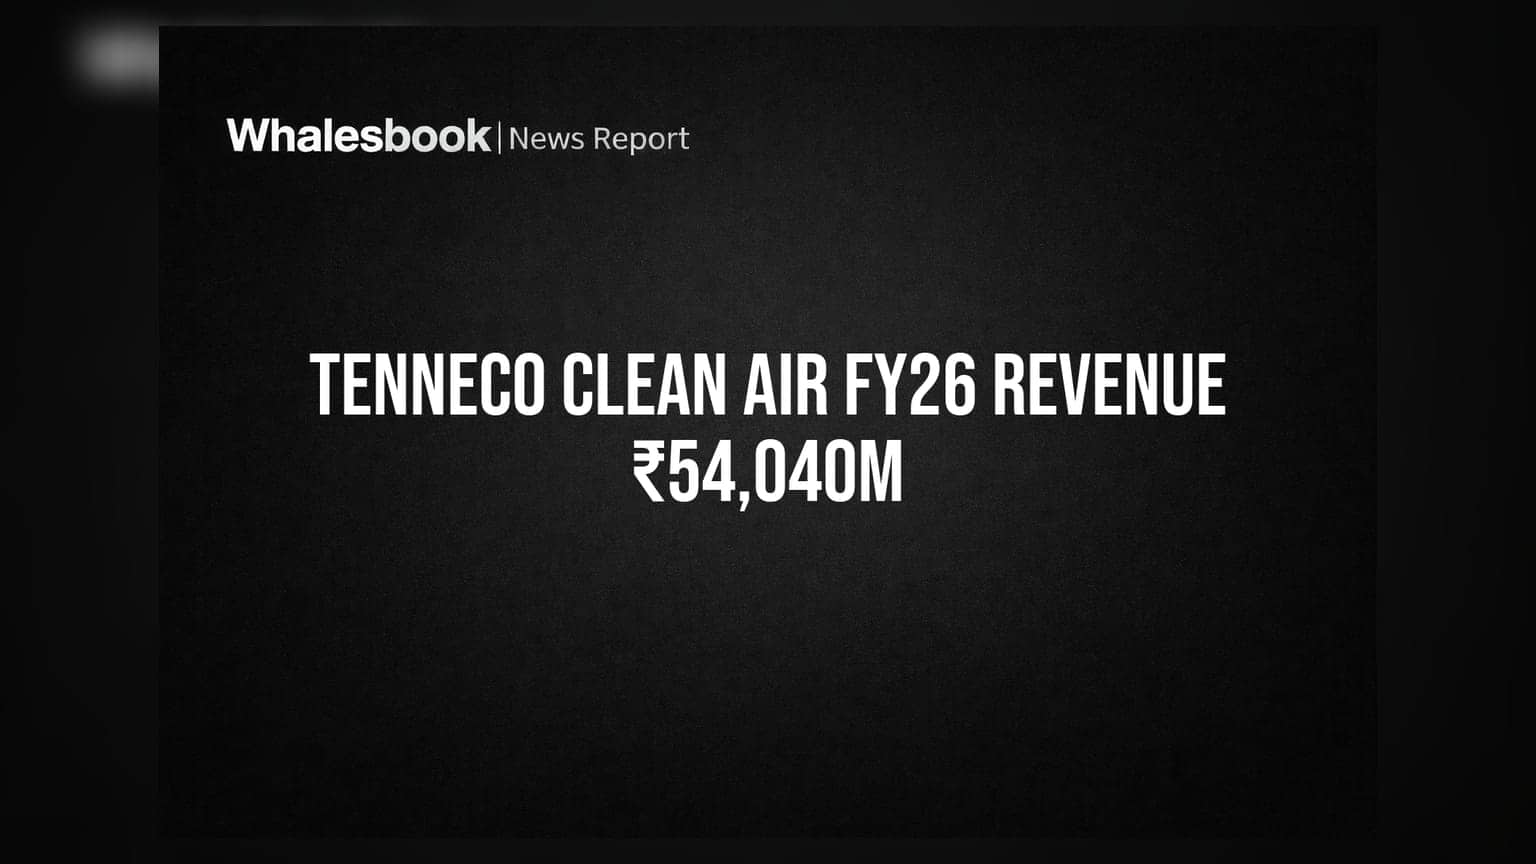
Revenue from operations: ₹54,039.76 million
Profit After Tax (PAT): ₹6,043.59 million
Reader Takeaway: Strong revenue growth and high profitability, with a focus on Value Added Revenue for clearer investor insight.
What just happened
Tenneco Clean Air India Limited has announced its Key Performance Indicators (KPIs) for the financial year ended March 31, 2026. The company reported a significant increase in its financial and operational metrics, emphasizing 'Value Added Revenue' (VAR) to present a more normalized view of its core business by excluding volatile substrate costs.
Why this matters
This disclosure offers investors a transparent look at the company's performance, particularly its operational strength. By focusing on VAR, Tenneco Clean Air India is providing a metric that better reflects its underlying business health, unaffected by fluctuating precious metal prices in substrates. Strong profitability and efficiency ratios suggest a stable and well-managed business.
The backstory
While specific historical data for Tenneco Clean Air India's standalone performance is not provided in this filing, the company is part of the global Tenneco Inc. framework, known for its emission control and ride performance products.
What changes now
Investors have clearer insights into the company's operational performance and financial health. The emphasis on VAR alongside traditional metrics like Revenue from Operations and PAT allows for a more nuanced understanding of the business's intrinsic value and efficiency.
Risks to watch
While the filing highlights strengths, investors should monitor the company's net cash position, which is currently negative at ₹(5,197.30) million, indicating higher debt than cash reserves. Fluctuations in raw material costs and competitive pressures in the automotive component sector remain underlying risks.
Peer comparison
(No peer comparison data provided in the filing).
Context metrics (time-bound)
- Revenue from operations: ₹54,039.76 million, a 10.50% growth.
- Value added Revenue (VAR): ₹49,180.36 million, a 12.28% growth.
- EBITDA: ₹9,254.67 million, a 13.52% growth.
- Profit after tax (PAT): ₹6,043.59 million, a 9.26% growth.
- PAT Margin: 11.18% (on revenue from operations) and 12.29% (on VAR).
- ROE: 42.97%
- ROCE: 94.19%
What to track next
Investors should track the company's continued focus on VAR, its ability to improve its net cash position, and its performance across the Clean Air and Powertrain Solutions Division and the Advanced Ride Technologies Division in upcoming financial reports.