Kalpataru Power Transmission Ltd is a global EPC player with diversified interest in power transmission and distribution, oil and gas pipeline, railways and biomass based power generation.[1]
Overview:[1]Established in 1981, Company is a global engineering and construction company with industry leading capabilities in energy and infrastructure projects. They have executed 250+ projects across 5 continents, has a global reach in 75 countries and has live projects in 30+ countries. 10,700+ employees worldwide with 40+ nationalities. Company has credit rating of AA/stable by CRISIL and India ratings.
| S.No. | Name | Current Price (Rs.) | Price to Earning | Market Capitalization (Rs.Cr.) | Dividend yield (%) | Net Profit latest quarter (Rs.Cr.) | YOY Quarterly profit growth (%) | Sales latest quarter (Rs.Cr.) | YOY Quarterly sales growth (%) | Return on capital employed (%) | Sales (Rs.Cr.) | OPM (%) | Profit after tax (Rs.Cr.) | Profit after tax latest quarter (Rs.Cr.) | Price to book value | Return on assets (%) | Debt to equity |
|---|---|---|---|---|---|---|---|---|---|---|---|---|---|---|---|---|---|
| 1. | Larsen & Toubro | 3856.40 | 33.00 | 530520.17 | 0.88 | 4678.01 | 15.63 | 67983.53 | 10.44 | 14.49 | 270722.51 | 12.67 | 16074.88 | 3926.09 | 5.23 | 4.98 | 1.32 |
| 2. | Rail Vikas | 335.15 | 61.54 | 69869.12 | 0.51 | 230.52 | -19.73 | 5122.97 | 5.52 | 14.72 | 20026.00 | 4.70 | 1135.41 | 230.29 | 7.31 | 6.40 | 0.52 |
| 3. | NBCC | 103.72 | 41.93 | 27999.08 | 0.65 | 156.69 | 25.71 | 2910.20 | 18.99 | 33.17 | 12751.71 | 5.04 | 667.83 | 153.52 | 10.48 | 4.68 | 0.00 |
| 4. | IRB Infra.Devl. | 41.50 | 28.65 | 25079.85 | 0.72 | 140.82 | 41.00 | 1751.02 | 10.42 | 7.82 | 8024.67 | 48.08 | 875.41 | 140.82 | 1.23 | 2.01 | 1.02 |
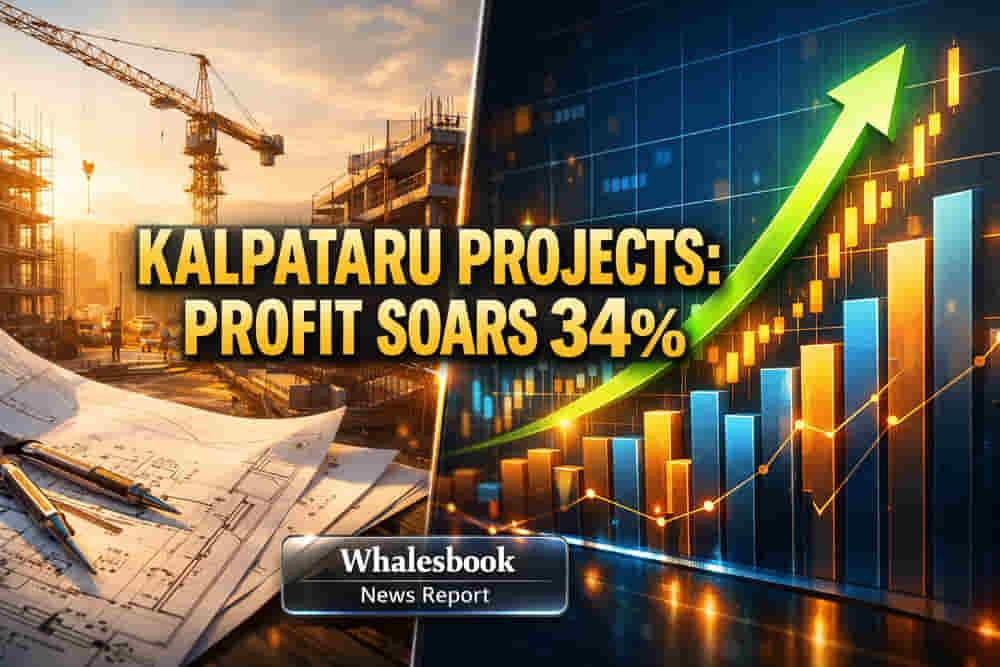
| 5. | Kalpataru Proj. | 1149.10 | 23.84 | 19617.43 | 0.78 | 199.91 | 51.08 | 5418.78 | 31.01 | 14.96 | 21488.39 | 8.38 | 822.93 | 199.91 | 2.60 | 3.08 | 0.50 |
| 6. | KEC International | 681.35 | 26.58 | 18154.42 | 0.81 | 160.75 | 88.21 | 6091.56 | 19.13 | 17.98 | 23335.94 | 7.26 | 683.11 | 160.75 | 3.21 | 2.75 | 0.94 |
| 7. | Ircon Intl. | 162.49 | 25.45 | 15284.30 | 1.63 | 136.51 | -32.68 | 1976.75 | -19.23 | 11.60 | 9787.96 | 7.43 | 600.65 | 138.65 | 2.37 | 3.74 | 0.80 |
| – | Median: 117 Co. | 128.76 | 17.77 | 481.95 | 0.0 | 9.21 | 23.05 | 149.57 | 10.73 | 18.43 | 506.52 | 12.78 | 30.76 | 9.16 | 2.09 | 6.85 | 0.44 |
Standalone figures in ₹ crores
| Sep 2022 | Dec 2022 | Mar 2023 | Jun 2023 | Sep 2023 | Dec 2023 | Mar 2024 | Jun 2024 | Sep 2024 | Dec 2024 | Mar 2025 | Jun 2025 | Sep 2025 | |
|---|---|---|---|---|---|---|---|---|---|---|---|---|---|
Sales | 3,293 | 3,509 | 4,396 | 3,622 | 3,844 | 4,147 | 5,146 | 3,722 | 4,136 | 4,826 | 6,204 | 5,040 | 5,419 |
Expenses | 3,017 | 3,204 | 4,085 | 3,308 | 3,535 | 3,803 | 4,748 | 3,408 | 3,788 | 4,424 | 5,681 | 4,611 | 4,972 |
Operating Profit | 276 | 305 | 311 | 314 | 309 | 344 | 399 | 313 | 348 | 402 | 523 | 428 | 447 |
Other Income | 15 | 9 | 76 | 29 | 25 | 27 | -2 | 29 | 26 | 19 | -10 | 23 | 24 |
Profit before tax | 145 | 165 | 220 | 175 | 160 | 194 | 210 | 164 | 184 | 218 | 331 | 274 | 272 |
Tax % | 28% | 33% | 31% | 28% | 29% | 26% | 29% | 29% | 28% | 28% | 27% | 27% | 27% |
Net Profit | 104 | 111 | 152 | 126 | 113 | 144 | 150 | 117 | 132 | 157 | 242 | 201 | 200 |
EPS in Rs | 6.98 | 7.45 | 9.36 | 7.76 | 6.95 | 8.86 | 9.23 | 7.18 | 8.15 | 9.21 | 14.15 | 11.76 | 11.71 |
Standalone Figures in ₹ Crores / Yearly
| Mar 2014 | Mar 2015 | Mar 2016 | Mar 2017 | Mar 2018 | Mar 2019 | Mar 2020 | Mar 2021 | Mar 2022 | Mar 2023 | Mar 2024 | Mar 2025 | TTM | |
|---|---|---|---|---|---|---|---|---|---|---|---|---|---|
Sales | 4,022 | 4,381 | 4,265 | 4,841 | 5,741 | 7,115 | 7,904 | 7,671 | 12,407 | 14,337 | 16,760 | 18,888 | 21,488 |
Expenses | 3,610 | 3,928 | 3,773 | 4,238 | 5,027 | 6,269 | 6,986 | 6,801 | 11,442 | 13,039 | 15,233 | 17,132 | 19,688 |
Operating Profit | 413 | 453 | 491 | 603 | 715 | 846 | 919 | 869 | 966 | 1,298 | 1,526 | 1,756 | 1,801 |
Other Income | 47 | 52 | 54 | 49 | 48 | 51 | 82 | 248 | 162 | 166 | 78 | 65 | 57 |
Interest | 171 | 167 | 166 | 172 | 187 | 187 | 225 | 171 | 356 | 430 | 498 | 550 | 381 |
Depreciation | 70 | 85 | 84 | 78 | 77 | 86 | 110 | 115 | 272 | 295 | 368 | 375 | 381 |
Profit before tax | 219 | 253 | 296 | 403 | 499 | 624 | 666 | 831 | 500 | 739 | 739 | 896 | 1,095 |
Net Profit | 146 | 166 | 192 | 269 | 322 | 401 | 463 | 615 | 350 | 532 | 533 | 648 | 800 |
EPS in Rs | 9.54 | 10.79 | 12.54 | 17.53 | 20.98 | 26.15 | 29.93 | 41.32 | 23.53 | 32.75 | 32.81 | 37.94 | 46.83 |
Dividend Payout % | 16% | 14% | 12% | 11% | 12% | 11% | 12% | 24% | 28% | 21% | 24% | 24% | – |
Standalone figures in ₹ crores
| Mar 2014 | Mar 2015 | Mar 2016 | Mar 2017 | Mar 2018 | Mar 2019 | Mar 2020 | Mar 2021 | Mar 2022 | Mar 2023 | Mar 2024 | Mar 2025 | Sep 2025 | |
|---|---|---|---|---|---|---|---|---|---|---|---|---|---|
Equity Capital | 31 | 31 | 31 | 31 | 31 | 31 | 31 | 30 | 30 | 32 | 32 | 34 | 34 |
Reserves | 1,923 | 2,040 | 2,184 | 2,448 | 2,739 | 3,121 | 3,505 | 3,833 | 4,907 | 5,287 | 5,718 | 7,151 | 7,507 |
Borrowings | 785 | 971 | 599 | 695 | 773 | 647 | 1,334 | 1,309 | 2,757 | 3,012 | 3,330 | 3,461 | 3,754 |
Other Liabilities | 1,857 | 1,752 | 2,431 | 2,931 | 3,734 | 4,453 | 4,785 | 4,486 | 7,428 | 9,406 | 10,909 | 12,820 | 12,557 |
Total Liabilities | 4,596 | 4,794 | 5,245 | 6,105 | 7,278 | 8,252 | 9,655 | 9,658 | 15,122 | 17,738 | 19,989 | 23,466 | 23,852 |
Fixed Assets | 574 | 554 | 538 | 521 | 527 | 571 | 634 | 674 | 1,342 | 1,697 | 1,656 | 1,912 | 2,070 |
Gross Block | 928.09 | 983.97 | 599.31 | 659.39 | 739.42 | 860.93 | 1,031.25 | 1,150.69 | 2,399.74 | 2,790.88 | 3,008.21 | 3,430.46 | – |
Accumulated Depreciation | 354.30 | 430.42 | 60.87 | 138.38 | 212.64 | 290.27 | 397.53 | 476.20 | 1,057.41 | 1,094.07 | 1,352.36 | 1,518.04 | – |
CWIP | 18 | 5 | 4 | 3 | 17 | 8 | 40 | 14 | 20 | 48 | 32 | 26 | 36 |
Investments | 384 | 394 | 518 | 716 | 785 | 649 | 864 | 886 | 892 | 874 | 859 | 1,163 | 1,259 |
Other Assets | 3,621 | 3,841 | 4,185 | 4,866 | 5,949 | 7,025 | 8,117 | 8,083 | 12,867 | 15,119 | 17,442 | 20,364 | 20,488 |
Total Assets | 4,596 | 4,794 | 5,245 | 6,105 | 7,278 | 8,252 | 9,655 | 9,658 | 15,122 | 17,738 | 19,989 | 23,466 | 23,852 |
Standalone Figures in ₹ Crores / Yearly
| Mar 2014 | Mar 2015 | Mar 2016 | Mar 2017 | Mar 2018 | Mar 2019 | Mar 2020 | Mar 2021 | Mar 2022 | Mar 2023 | Mar 2024 | Mar 2025 | |
|---|---|---|---|---|---|---|---|---|---|---|---|---|
Cash from Operating Activity | 84 | 37 | 756 | 322 | 103 | 525 | 243 | 198 | 46 | 559 | 714 | 837 |
Cash from Investing Activity | -97 | -43 | -170 | -213 | -186 | -172 | -477 | 244 | 126 | -443 | -469 | -774 |
Cash from Financing Activity | 24 | 20 | -555 | -3 | -49 | -292 | 401 | -436 | 263 | -223 | -176 | 542 |
Net Cash Flow | 12 | 14 | 31 | 106 | -132 | 62 | 167 | 6 | 435 | -107 | 68 | 606 |
Standalone Figures in ₹ Crores / Yearly
| Mar 2014 | Mar 2015 | Mar 2016 | Mar 2017 | Mar 2018 | Mar 2019 | Mar 2020 | Mar 2021 | Mar 2022 | Mar 2023 | Mar 2024 | Mar 2025 | |
|---|---|---|---|---|---|---|---|---|---|---|---|---|
Debtor Days | 140 | 149 | 190 | 208 | 209 | 168 | 162 | 178 | 121 | 126 | 117 | 139 |
Inventory Days | 106 | 116 | 87 | 81 | 67 | 77 | 83 | 78 | 59 | 61 | 63 | 65 |
Days Payable | 245 | 263 | 303 | 280 | 265 | 255 | 239 | 300 | 241 | 258 | 265 | 291 |
Cash Conversion Cycle | 2 | 1 | -27 | 10 | 11 | -9 | 6 | -44 | -61 | -71 | -85 | -86 |
Working Capital Days | 44 | 60 | 87 | 54 | 77 | 86 | 74 | 88 | 81 | 52 | 59 | 56 |
ROCE % | 15% | 15% | 16% | 19% | 20% | 22% | 20% | 17% | 12% | 14% | 15% | 15% |
Direct from BSE filings, auto-summarised
External media mentions & references
Editorial & research coverage
Aug 2025
May 2025
Feb 2025
Oct 2024
Aug 2024
May 2024
Feb 2024
Nov 2023
Aug 2023
May 2023
Feb 2023
Nov 2022
Aug 2022
May 2022
Feb 2022
Feb 2022
Oct 2021
Aug 2021
May 2021
Feb 2021
Feb 2021
Nov 2020
Aug 2020
May 2020
Feb 2020
Nov 2019
Jul 2019
May 2019
Mar 2019
Feb 2019
Nov 2018
Aug 2018
May 2018
Feb 2018
Feb 2018
Dec 2017
Dec 2017
Nov 2017
Aug 2017
Aug 2017
Jun 2017
May 2017
May 2017
May 2017
Mar 2017
Feb 2017
Nov 2016
Aug 2016
May 2016
Feb 2016
Stock Analysis
Kalpataru Projects International Limited (KPIL) is a global EPC player engaged in energy and infrastructure projects.
By divesting non-core assets like VEPL, KPIL aims to enhance its focus on the core EPC business, positioning itself for accelerated growth.
No order book information is provided in this specific announcement.
No red flags are mentioned in this news update.
No specific future dates for observation are provided in this announcement.
Corporate Announcements