Abbott India Ltd is one of the leading multinational pharmaceutical companies in India and sells its products through independent distributors primarily within India.[1]It was established in 1944.[2]
Abbott GroupThe company is a part of Abbott Laboratories, USA which has a presence in 160 countries with leading medical devices, diagnostics, nutrition products, and branded generic medicines.[1]
| S.No. | Name | Current Price (Rs.) | Price to Earning | Market Capitalization (Rs.Cr.) | Dividend yield (%) | Net Profit latest quarter (Rs.Cr.) | YOY Quarterly profit growth (%) | Sales latest quarter (Rs.Cr.) | YOY Quarterly sales growth (%) | Return on capital employed (%) | Sales (Rs.Cr.) | OPM (%) | Profit after tax (Rs.Cr.) | Profit after tax latest quarter (Rs.Cr.) | Price to book value | Return on assets (%) | Debt to equity |
|---|---|---|---|---|---|---|---|---|---|---|---|---|---|---|---|---|---|
| 1. | Sun Pharma.Inds. | 1671.85 | 34.70 | 401132.88 | 0.95 | 3124.95 | 2.56 | 14478.31 | 8.93 | 20.21 | 54964.01 | 30.12 | 11543.96 | 3117.95 | 5.12 | 12.97 | 0.07 |
| 2. | Divi's Lab. | 6239.70 | 66.66 | 165644.38 | 0.47 | 689.00 | 35.10 | 2715.00 | 16.12 | 20.44 | 10029.00 | 32.37 | 2485.00 | 689.00 | 10.72 | 13.53 | 0.01 |
| 3. | Torrent Pharma. | 4024.95 | 62.86 | 136222.57 | 0.81 | 591.00 | 32.49 | 3302.00 | 14.30 | 27.05 | 12248.00 | 32.60 | 2166.53 | 600.17 | 16.14 | 13.26 | 0.33 |
| 4. | Cipla | 1399.40 | 20.77 | 113039.59 | 0.94 | 1353.37 | 3.73 | 7589.44 | 7.64 | 22.72 | 28349.57 | 25.40 | 5441.14 | 1351.17 | 3.39 | 14.72 | 0.01 |
| 5. | Lupin | 2174.20 | 23.07 | 99317.10 | 0.55 | 1484.83 | 73.34 | 7047.51 | 24.23 | 21.30 | 24750.69 | 27.25 | 4324.63 | 1477.92 | 5.08 | 12.41 | 0.32 |
| 6. | Dr Reddy's Labs | 1179.30 | 17.08 | 98427.95 | 0.67 | 1336.80 | 7.28 | 8828.30 | 9.83 | 22.69 | 34310.00 | 24.64 | 5772.20 | 1347.10 | 2.74 | 12.95 | 0.16 |
| 7. | Mankind Pharma | 2173.55 | 51.35 | 89725.23 | 0.04 | 520.18 | -22.00 | 3697.16 | 20.77 | 15.98 | 13545.67 | 24.12 | 1748.55 | 511.51 | 5.96 | 8.89 | 0.55 |
| 8. | Abbott India | 27775.00 | 39.17 | 59021.89 | 1.69 | 415.27 | 15.80 | 1757.15 | 7.62 | 46.25 | 6714.37 | 26.99 | 1508.95 | 415.27 | 14.70 | 25.47 | 0.05 |
| – | Median: 149 Co. | 390.6 | 29.92 | 1763.55 | 0.11 | 13.49 | 11.71 | 161.76 | 10.58 | 14.89 | 591.73 | 15.93 | 45.26 | 13.96 | 3.07 | 8.56 | 0.22 |
Standalone figures in ₹ crores
| Sep 2022 | Dec 2022 | Mar 2023 | Jun 2023 | Sep 2023 | Dec 2023 | Mar 2024 | Jun 2024 | Sep 2024 | Dec 2024 | Mar 2025 | Jun 2025 | Sep 2025 | |
|---|---|---|---|---|---|---|---|---|---|---|---|---|---|
Sales | 1,379 | 1,322 | 1,343 | 1,479 | 1,494 | 1,437 | 1,439 | 1,558 | 1,633 | 1,614 | 1,605 | 1,738 | 1,757 |
Expenses | 1,036 | 1,010 | 1,063 | 1,124 | 1,113 | 1,049 | 1,109 | 1,167 | 1,194 | 1,178 | 1,176 | 1,293 | 1,255 |
Operating Profit | 343 | 312 | 280 | 355 | 381 | 388 | 330 | 391 | 439 | 436 | 429 | 446 | 502 |
Other Income | 34 | 44 | 50 | 56 | 56 | 56 | 81 | 67 | 60 | 72 | 76 | 73 | 70 |
Profit before tax | 355 | 335 | 308 | 390 | 415 | 422 | 390 | 437 | 479 | 488 | 483 | 493 | 546 |
Tax % | 25% | 26% | 25% | 26% | 25% | 26% | 26% | 25% | 25% | 26% | 24% | 26% | 24% |
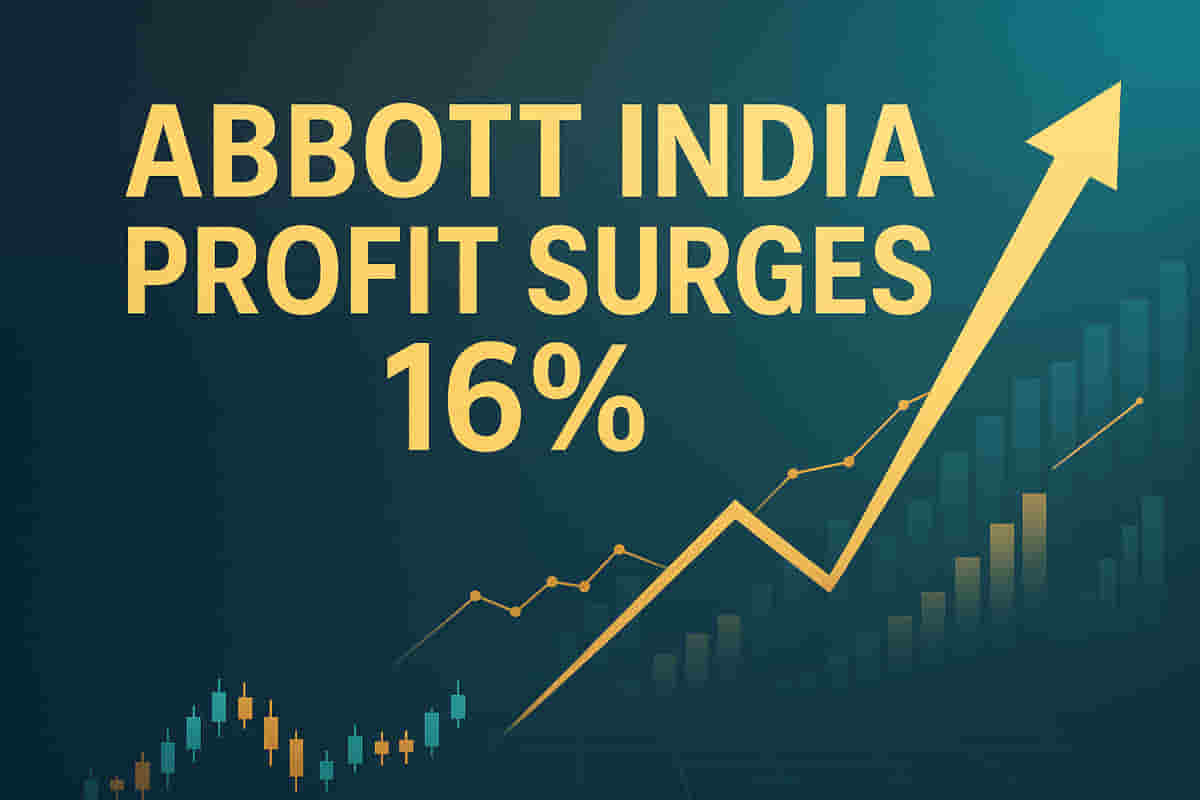
Net Profit | 266 | 247 | 231 | 290 | 313 | 311 | 287 | 328 | 359 | 361 | 367 | 366 | 415 |
EPS in Rs | 124.95 | 116.16 | 108.91 | 136.59 | 147.27 | 146.35 | 135.09 | 154.36 | 168.76 | 169.78 | 172.73 | 172.18 | 195.43 |
Standalone Figures in ₹ Crores / Yearly
| Mar 2014 | Mar 2015 | Mar 2016 | Mar 2017 | Mar 2018 | Mar 2019 | Mar 2020 | Mar 2021 | Mar 2022 | Mar 2023 | Mar 2024 | Mar 2025 | TTM | |
|---|---|---|---|---|---|---|---|---|---|---|---|---|---|
Sales | 2,276 | 2,289 | 2,614 | 2,903 | 3,298 | 3,679 | 4,093 | 4,310 | 4,919 | 5,349 | 5,849 | 6,409 | 6,714 |
Expenses | 2,009 | 1,977 | 2,250 | 2,505 | 2,774 | 3,074 | 3,336 | 3,388 | 3,832 | 4,143 | 4,396 | 4,714 | 4,902 |
Operating Profit | 267 | 312 | 365 | 398 | 525 | 605 | 757 | 922 | 1,088 | 1,206 | 1,453 | 1,695 | 1,812 |
Other Income | 49 | 48 | 50 | 57 | 117 | 113 | 114 | 81 | 77 | 154 | 248 | 275 | 291 |
Interest | 0 | 0 | 3 | 2 | 4 | 2 | 9 | 18 | 19 | 16 | 12 | 11 | 20 |
Depreciation | 22 | 15 | 14 | 16 | 16 | 17 | 60 | 58 | 66 | 70 | 71 | 72 | 74 |
Profit before tax | 295 | 344 | 398 | 436 | 621 | 699 | 803 | 926 | 1,080 | 1,274 | 1,618 | 1,887 | 2,009 |
Net Profit | 198 | 229 | 255 | 277 | 401 | 450 | 593 | 691 | 799 | 949 | 1,201 | 1,414 | 1,509 |
EPS in Rs | 93.39 | 107.75 | 120.12 | 130.19 | 188.82 | 211.93 | 279.04 | 325.04 | 375.87 | 446.80 | 565.30 | 665.64 | 710.12 |
Dividend Payout % | 25% | 29% | 29% | 31% | 29% | 31% | 90% | 85% | 73% | 73% | 73% | 71% | – |
Standalone figures in ₹ crores
| Mar 2014 | Mar 2015 | Mar 2016 | Mar 2017 | Mar 2018 | Mar 2019 | Mar 2020 | Mar 2021 | Mar 2022 | Mar 2023 | Mar 2024 | Mar 2025 | Sep 2025 | |
|---|---|---|---|---|---|---|---|---|---|---|---|---|---|
Equity Capital | 21 | 21 | 21 | 21 | 21 | 21 | 21 | 21 | 21 | 21 | 21 | 21 | 21 |
Reserves | 767 | 916 | 1,174 | 1,366 | 1,672 | 1,987 | 2,410 | 2,581 | 2,799 | 3,167 | 3,678 | 4,212 | 3,990 |
Borrowings | 0 | 0 | 0 | 0 | 0 | 0 | 175 | 153 | 152 | 113 | 83 | 197 | 182 |
Other Liabilities | 351 | 436 | 421 | 679 | 723 | 932 | 940 | 1,086 | 1,253 | 1,254 | 1,411 | 1,487 | 1,501 |
Total Liabilities | 1,139 | 1,374 | 1,616 | 2,066 | 2,416 | 2,941 | 3,547 | 3,840 | 4,224 | 4,556 | 5,193 | 5,917 | 5,694 |
Fixed Assets | 98 | 96 | 108 | 110 | 81 | 105 | 270 | 251 | 271 | 237 | 225 | 336 | 314 |
Gross Block | 209.23 | 215.65 | 122.83 | 139.69 | 124.25 | 164.35 | 344.84 | 340.62 | 381.98 | 366.93 | 424.50 | 552.63 | – |
Accumulated Depreciation | 110.98 | 119.61 | 14.37 | 30.10 | 42.87 | 59.39 | 75.01 | 89.84 | 110.98 | 130.02 | 199.56 | 216.65 | – |
CWIP | 1 | 4 | 3 | 6 | 2 | 1 | 2 | 1 | 1 | 4 | 10 | 18 | 23 |
Investments | 0 | 0 | 0 | 0 | 0 | 0 | 0 | 0 | 0 | 0 | 0 | 0 | 0 |
Other Assets | 1,040 | 1,274 | 1,505 | 1,950 | 2,333 | 2,835 | 3,275 | 3,589 | 3,952 | 4,315 | 4,958 | 5,563 | 5,357 |
Total Assets | 1,139 | 1,374 | 1,616 | 2,066 | 2,416 | 2,941 | 3,547 | 3,840 | 4,224 | 4,556 | 5,193 | 5,917 | 5,694 |
Standalone Figures in ₹ Crores / Yearly
| Mar 2014 | Mar 2015 | Mar 2016 | Mar 2017 | Mar 2018 | Mar 2019 | Mar 2020 | Mar 2021 | Mar 2022 | Mar 2023 | Mar 2024 | Mar 2025 | |
|---|---|---|---|---|---|---|---|---|---|---|---|---|
Cash from Operating Activity | 155 | 215 | 249 | 307 | 153 | 499 | 626 | 727 | 948 | 893 | 1,213 | 1,012 |
Cash from Investing Activity | -144 | -187 | -77 | -155 | -215 | -257 | -401 | -72 | -396 | -148 | -416 | 182 |
Cash from Financing Activity | -42 | -58 | -80 | -90 | -102 | -143 | -217 | -582 | -637 | -639 | -745 | -925 |
Net Cash Flow | -31 | -30 | 91 | 62 | -165 | 99 | 8 | 73 | -86 | 107 | 52 | 269 |
Standalone Figures in ₹ Crores / Yearly
| Mar 2014 | Mar 2015 | Mar 2016 | Mar 2017 | Mar 2018 | Mar 2019 | Mar 2020 | Mar 2021 | Mar 2022 | Mar 2023 | Mar 2024 | Mar 2025 | |
|---|---|---|---|---|---|---|---|---|---|---|---|---|
Debtor Days | 18 | 21 | 20 | 22 | 29 | 27 | 28 | 21 | 21 | 22 | 20 | 22 |
Inventory Days | 101 | 107 | 91 | 107 | 112 | 106 | 83 | 110 | 94 | 80 | 70 | 92 |
Days Payable | 38 | 54 | 56 | 101 | 92 | 116 | 104 | 116 | 122 | 109 | 114 | 110 |
Cash Conversion Cycle | 80 | 74 | 54 | 28 | 49 | 17 | 8 | 14 | -6 | -8 | -24 | 3 |
Working Capital Days | 36 | 30 | 32 | 21 | 63 | 22 | 10 | 4 | -7 | -8 | -14 | 97 |
ROCE % | 39% | 40% | 38% | 34% | 41% | 37% | 35% | 35% | 38% | 41% | 46% | 46% |
Direct from BSE filings, auto-summarised
External media mentions & references
Editorial & research coverage
No credit ratings.
Sep 2022
Jun 2021
Stock Analysis
Corporate Announcements